
Castalia’s John Sachs shares his thoughts on recent developments in the sector.
Like many in the industry, we have spent the last few weeks trying to understand how the COVID-19 crisis will impact electric utilities and IPPs in emerging markets. Our early fears, raised in our late April blog “Assessing the impact of force majeure on emerging markets PPPs”, are starting to come true. The COVID-19 pandemic is putting many state-owned electric utilities in emerging markets under increasing financial stress and jeopardizing not only their IPP programs but also risking wider contagion in the economies. We are seeing this across the globe, IPPs receiving notices of payments being deferred, or threats of declaring force majeure, often with no details of for how long or if or when the IPPs will ever be made whole. The latest example of this financial stress, and the threat of declaring force majeure, was reported this week in Kenya.
This financial stress—resulting from a mix of reductions in demand, consumer tariff forgiveness and deferrals granted by the Governments for social reasons, and greater difficulty in accessing finance—is likely to last beyond the immediate period of emergency pandemic response. An additional source of stress may also be originating from the independent power producers (IPPs), who in some cases may be unable to fully satisfy their Operations and Maintenance responsibilities, import parts, or be faced with foreign exchange constraints due to the pandemic.
What we recommended in April remains even more true today, “Governments and authorities managing infrastructure concessions should get ahead of this through a rapid assessment of their PPP portfolios to identify and measure risk factors, including exposure under their force majeure clauses, develop action-oriented steps to manage the risks and, when appropriate, commence early engagement with private sector operators.” This early engagement to amicably work-out a solution with investors and their lenders could help avoid damage to their investment climates, cost of capital, and resulting cost of service from future PPP projects.
Last week Castalia posted a blog about how Liquidity Facilities could be the solution to providing emergency financial support to water utilities in response to the COVID-19 pandemic. We received a lot of interesting comments about the relevance of this topic (for example, U.S. water utilities actively lobbying Congress to get stimulus money to compensate for their COVID-related losses) and thoughtful questions about the detailed design of these Facilities.
So the Chief Executive of Castalia, David Ehrhardt (DE) answered some of the frequently asked questions about the options in the design of a Facility.
Question 1: How should the scale of required financial support be assessed?
DE response: In this fast-moving crisis, we need quick options to assess financial need. These include existing utility financial models and a World Bank model created for this purpose (COVID-19 Financial Impact Assessment Tool for Water Service Providers). These can be done utility by utility and then added up for a national estimate. Alternatively, data from other similar countries could be used if available. Obviously, you should do high and low scenarios as well as a base case.
Question 2: Will the Facility be a national body, or could it be regional or subnational?
DE response: Almost all Facilities will be at the national level because the money in the Facility has to come from (or be guaranteed by) the national government. That being said, there could be exceptions such as a regional facility for small nations with regional institutions already in place (such as the Organization of Eastern Caribbean States); or a state-level Facility in Federal Systems with states or provinces having responsibility for water (as in Brazil, Nigeria, and India).
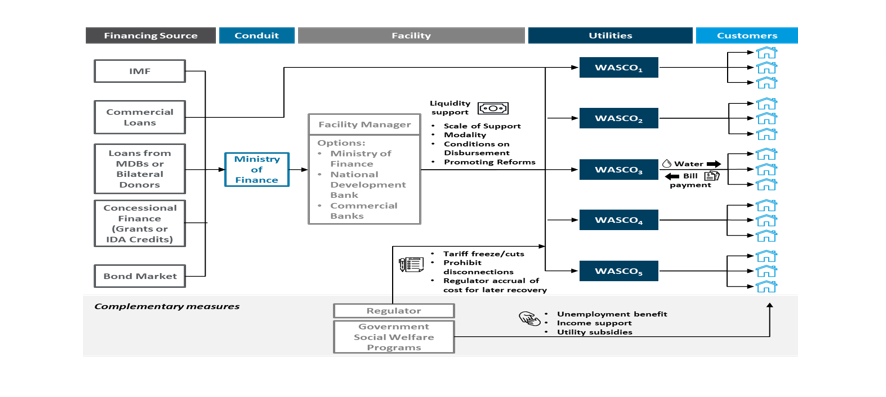
Question 3: Which entity will manage the Facility?
DE response: Using existing institutions to manage the Facility will make the Facility quicker to get up and running. Some options for a Facility Manager include:
- A national development bank (such as BNDES in Brazil) or water sector financing agency (such as LWUA in the Philippines)
- A unit in the Ministry of Finance that has experience running government grant or loan schemes and fiscal transfers
- A bank operating under contract to the government with strict guidelines and clear responsibilities, or offering loans with government guarantees (similar to the US Paycheck Protection Program for general business continuity), again with clear guidelines and responsibilities
- A regional development bank or monetary authority (such as the OECS Central Bank or the Caribbean Development Bank), in those cases where a regional fund is judged to be appropriate.
Question 4: What monitoring and fiduciary arrangements are needed?
DE response: At a minimum, the Facility will need a Procedures manual; agreements or contracts with the recipient utilities; accounting systems; clarity on the role of the independent auditor; and clarity on the role of the regulatory entity.
Question 5: What sources can finance the Facility?
DE response: In the majority of cases, the government is going to have to put up the money, or at least guarantee it. In developing countries, the government’s first source of finance during this crisis is likely the IMF and then multilateral and bilateral development finance institutions. To pay out large amounts of cash to water utilities, the government will need to borrow large amounts of money and potentially borrow more money over time. It, therefore, makes sense to set up a Facility that can aggregate money from several different sources at several different times.
Question 6: How will funds be disbursed from the Facility to utilities?
DE response: This is a great question. I think that the modality for disbursement should be loans because the Facility can get the money out the door quickly while also encouraging performance improvements and minimizing fiscal costs (of course, there could still be a fiscal cost because some utilities may default on their loan. In these cases, the disbursement could be converted to a grant). Another good option is for the government to guarantee lending from a commercial bank because it shifts the burden of loan administration to the commercial bank and brings utilities and banks together. All that being said, grants are obviously the simplest, quickest option.
Question 7: Should the Facility attempt to promote utility reforms?
DE response: I think that, at the very least, the designer of the Facility should consider attaching reform requirements to assistance from the Facility. Water utilities, and importantly, their inefficiencies, are finally getting the attention of the Minister of Finance. This creates a rare opportunity to have multi-level stakeholder support for vital reforms. Of course, though I encourage considering promoting reforms, the designer of the Facility must remember that the overriding aim must be to quickly get money to utilities in sufficient quantities to allow them to remain operational.
DE closing remarks: Thank you for all of your thoughtful questions. Please comment to let us know your thoughts and if you think we have missed some important option or consideration. I look forward to continuing this discussion with all of you. If anyone reading needs help with these questions, please let me know
Interviewed by: Lisa Nations.

This is Clive Harrison‘s second update to his spreadsheet-based pandemic model. The original model was posted on this blog on April 22 and the first update was posted on May 4.
The disease was spreading too quickly in my updated model. The proportion of asymptomatics is not as high as I believed the Swedish data was suggesting. The problem was/is that the numbers of deaths for the final 14 days or so of each edition of the published data are incomplete, so are revised upwards in subsequent editions with data arriving from the regions. That meant that the rapid fall in the death rate after a peak the data seemed to show when I last wrote was just artefact of the data collection system. You can see this in the attached worksheet, in the two charts below the Sweden data in “Common and calibration data”.
I followed this for a few weeks to see how the process works and then, this week, I felt I could make a reasonable estimate the adjustments that will take place over the next few weeks to obtain a sensible set of calibration data. It is clear that my model cannot replicate the smooth and prolonged log-linear decline in the actual numbers of daily deaths in the latest data using the numbers of cases implied by the very low mortality rates I was using last time.
To match the latest data I reduced the number of cases by increasing the mortality rate. The model started to approach a calibration at a mortality rate of 0.1%. I also looked again at the actions the Swedish authorities took in March. These included limits on meeting sizes and some distancing restrictions and recommendations in mid-March tightened somewhat at the end of March. You can see from the data that, contrary to popular belief, the Swedes and their government have been very effective at limiting the rate of spread, apart from a blip in care homes for the elderly that was quickly dealt with.
I used a second distancing phase match the tightening of the distancing measures in late March, which shows in the data, and tried calibrating the model for mortality rates of 0.1%, 0.2%, 0.3%, 0.4% and 0.5%. The rates above 0.1% do a better job of modelling the log-linear decline in the numbers of deaths, but the higher mortality rates require increasingly long doubling times. I think that rates of 0.2%, 0.3% and 0.4% give the best calibration results.
I kept the second distancing rate going until daily deaths fell to zero but then I always end up with a big ‘second wave’, sometimes months later. I introduced a third distancing phase to deal with this and experimented with that for mortality rates of 0.15%, 0.2% and 0.25% (which seemed to give the best calibrations). Fine-tuning this third distancing phase eliminates a ‘second wave’ altogether and shows that the final death toll is very sensitive to its timing and intensity.
If you have the time, it is worth playing with the four variables that control the third phase (in cells AF5, AD8, AF8 and AD9), while keeping the calibration values for the first and second distancing periods unchanged, and seeing how the final death toll (in cell G51, under the chart) responds. In the model, it seems that the best policy, to minimise the overall number of deaths, would be an immediate and controlled relaxation of distancing. This leads to a temporary increase in the number of daily deaths but an earlier end to the epidemic. In Sweden the second peak is below the first one, so would not over-stretch the medical resources, but that is unlikely to be the case in countries with much larger populations.
Death is a tricky subject. The increase in life expectancy in most places since 1945 is one of the many benefits of the global civilisation that has taken root since then and is currently being tested by this epidemic (among other things). Most people now die when they are old, which necessarily also means that most people who die are old. Some day, something, little or large, will tip each of us over the edge and into oblivion. At the moment COVID-19 is one of those things and wrinklies like me naturally make up the majority of the casualties. This is no excuse for negligence or disregard for the welfare and treatment of the elderly, but it’s not a reason for a lot of hand-wringing either.
The data seems to show that most Swedes have responded very effectively. Apparently traffic reduced immediately as people took fewer journeys and various other statistics show that responsible self-restraint has worked very well. I see that that there is now some internal dissent there because their death rate is much higher than in Norway and Denmark, where stricter measures were introduced. I think that the difference comes from Sweden being much closer to an end of the epidemic than their neighbours and that the final death tolls are probably a year away. When those numbers finally emerge they will probably be explained by demographic differences and the incidence of co-morbidity factors in the general population.
I hope that the Swedish government sticks to its guns and treats its people like the responsible citizens they seem to be, as an example to almost all the other governments in the western world.
Download the updated model here.
Read our other posts:


