Assessing Bus Fleet Decarbonization Options with the Zero-Emissions Bus Cost Model
The many options available to New Zealand’s Regional Councils make it difficult to identify the best way to procure new bus service operators. New bus technologies offer substantial opportunities to reduce emissions, but the question is, at what cost? Castalia is very happy to have collaborated with the New Zealand Transport Authority to help guide those councils and bus companies.
Our fully customizable zero-emission bus cost model and accompanying report help Regional Councils weigh the costs and benefits of different bus technologies for bus fleets. Decisionmakers can use the model to easily compare different bus technology options by the total cost of ownership (TCO) per kilometer on a purely financial basis while also considering the impact of greenhouse gas emissions and other harmful emissions from existing diesel buses.
Excitingly, in the process of designing and testing the model, our research revealed that Regional Councils can decrease costs for riders and achieve their climate goals. This is because zero-emissions buses already cost less on a purely financial TCO per kilometer basis than diesel buses. Further, zero-emissions buses have considerable additional health and environmental benefits from the perspective of society as a whole as a result of reduced greenhouse gas emissions and reduced impact of harmful emissions on the health of New Zealanders. Battery electric buses (BEBs) also offer significant financial and emissions savings compared to other bus technologies, including hydrogen fuel cell buses (HFCBs).
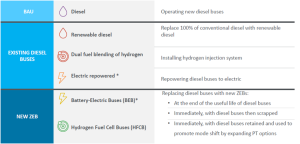
Regional Council decision-makers can use the model to easily compare the six most relevant bus technologies for NZ, shown in the diagram below. Crucially, the model also allows regional councils to weigh the costs and benefits of retiring existing diesel buses early, replacing existing diesel buses at the end of their useful lives, or replacing diesel buses on their exiting routes now and repurposing those buses to expand public transport options to induce more Kiwis to use public transport.
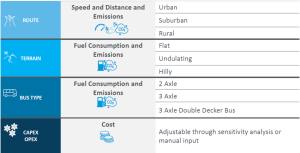
Regional Councils face diverse circumstances from hilly, densely populated Wellington to flatter, more spread-out Christchurch. As a result, the model is designed to be easily customizable to match the characteristics of the routes that the bus must serve.
As shown in the figure below, the model evaluates three types of routes with three terrain options for three different bus sizes. It also allows for conducting sensitivity analysis on key inputs such as fuel cost and bus capital cost.
The figure below shows an actual dashboard output for a sample scenario for two-axle buses on an urban, high-density, short-distance bus route over flat terrain. The figure shows the TCO per km of different bus technologies with and without considering the cost of emissions.
The light blue bars, which show the TCO per km without considering the cost of emissions, show that BEB is the least expensive technology at $1.04 per km. Further, the figure shows that it is least expensive to either retire diesel buses immediately and scrap them or use them to induce “mode shift” rather than replacing them at the end of their useful life.
When the model does consider the cost of emissions—represented by the grey bars in the figure below—replacing diesel buses with BEB immediately and scrapping the existing diesel buses is the least cost option on a TCO per km basis. In fact, the TCO per km is negative when considering the cost of emissions because the model accounts for the value of the avoided emissions that come from scrapping the diesel bus early. Hence, the social value of health and environmental costs avoided by taking a diesel bus off the road early completely outweigh the cost of buying and operating the new BEB.
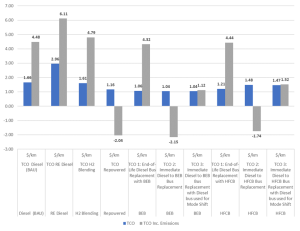
*The negative number for TCOs where existing diesel buses are replaced early reflects the finding that the health and environmental benefits of replacing diesel buses early are so great that they outweigh the costs of operating the bus compared to the BAU.
We look forward to working with interested parties to apply this exciting new model and share the results of our work!
The Study Report and the model are both available in New Zealand Transport Agency’s website.
The Study Report is available here: Zero Emissions Bus Economic Study
The model is available here: Zero Emissions Bus Model
Read more about our transportation work:
Hydrogen Modelling Study in New Zealand
Feasibility and Structuring of Ninh Binh—Bai Vot Expressway, Vietnam