Castalia’s blog
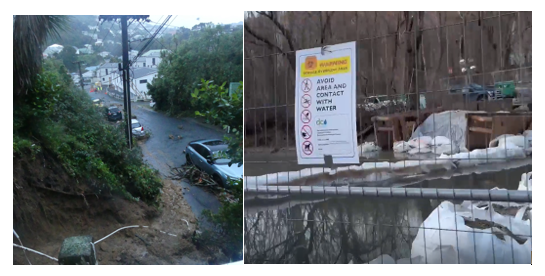
Massive sewage spills in Wellington and Washington, D.C. exposed the risks of aging wastewater infrastructure, deferred maintenance, and climate-driven storm events. This blog examines how two capital cities faced strikingly similar infrastructure failures—and the lessons for resilient urban water systems.
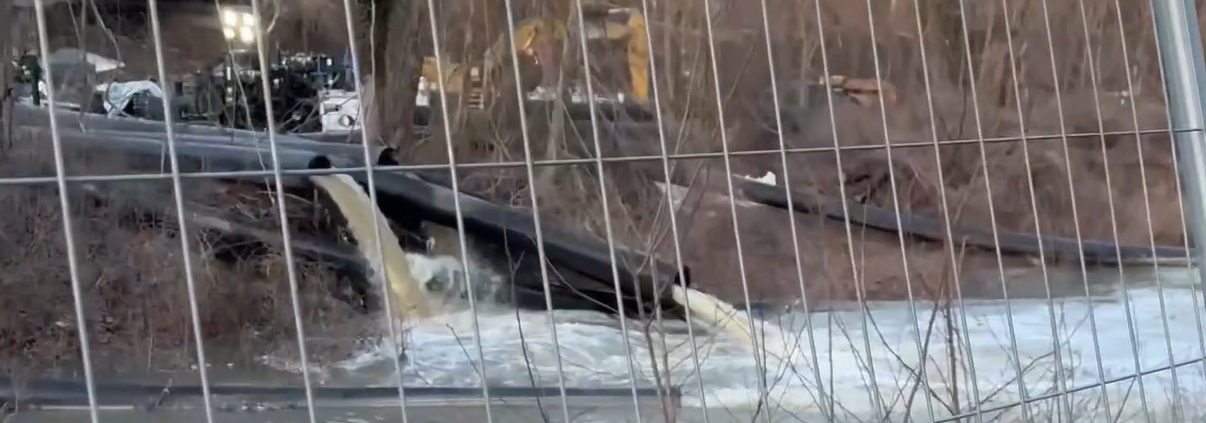
A catastrophic sewer line collapse in January 2026 released hundreds of millions of gallons of untreated wastewater into the Potomac River, triggering one of the largest sewage spills in U.S. history. With E. coli levels soaring and emergency measures in place, the incident exposes the dangers of aging infrastructure and the urgent need for investment in water systems.
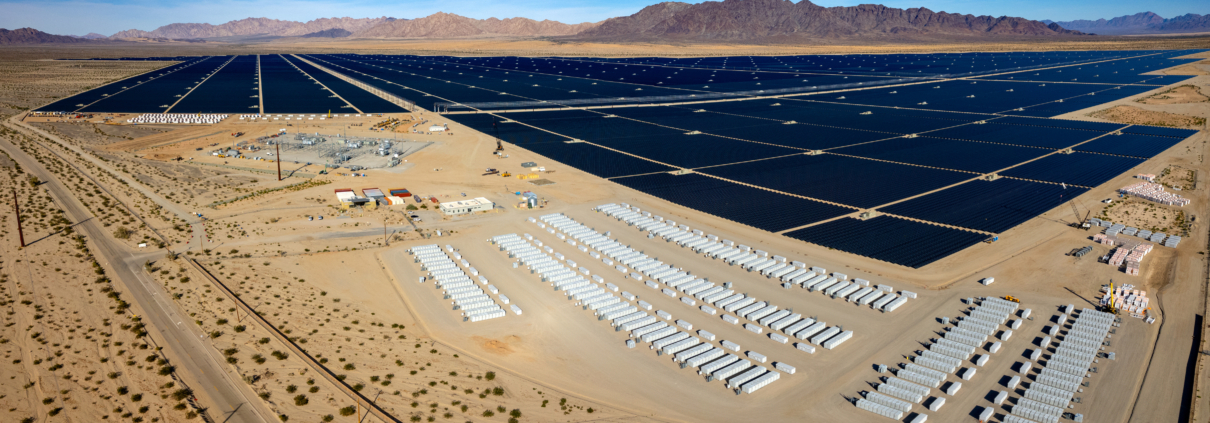
Battery storage costs have fallen 73% since 2018, making solar + BESS increasingly competitive with gas-fired generation. But while headline figures suggest solar can now deliver dispatchable 24/7 power, a closer look shows nighttime costs remain a major hurdle.
Read our other posts:


