Update on the spreadsheet-based pandemic model for COVID-19

Clive Harrison has updated his spreadsheet-based pandemic model that was posted on this blog on April 22.
I had a problem with the daily mortality data for Sweden last week, it became very irregular and it looked as though there was a weekly dip in daily deaths. This didn’t make any sense and then I found this article with a link to some new data from the Swedish National Board of Health and Welfare, which seems to be better prepared. Thus this update includes two worksheets for Sweden, one the new NBHW calibration data and the other with the data on the EU website that I had been using and I have used for all the other countries I have had a go at modelling (Canada, USA, UK, Italy, Spain, Portugal, France and Germany).
The Swedish model gives a mortality rate of 0.026%, so very much lower than most published estimates, and there is simply no other way to explain the daily time series of reported deaths. That implies a very large number of unreported cases everywhere. The NBHW notes that it expects that the number of deaths is likely to increase slightly as they get better data from around the country, and it seems that in most places there is at least anecdotal evidence of unreported deaths due to COVID, for various reasons. Thus I have calibrated to envelope the shape of the calibration data for each country, with some excess over the number of reported deaths.
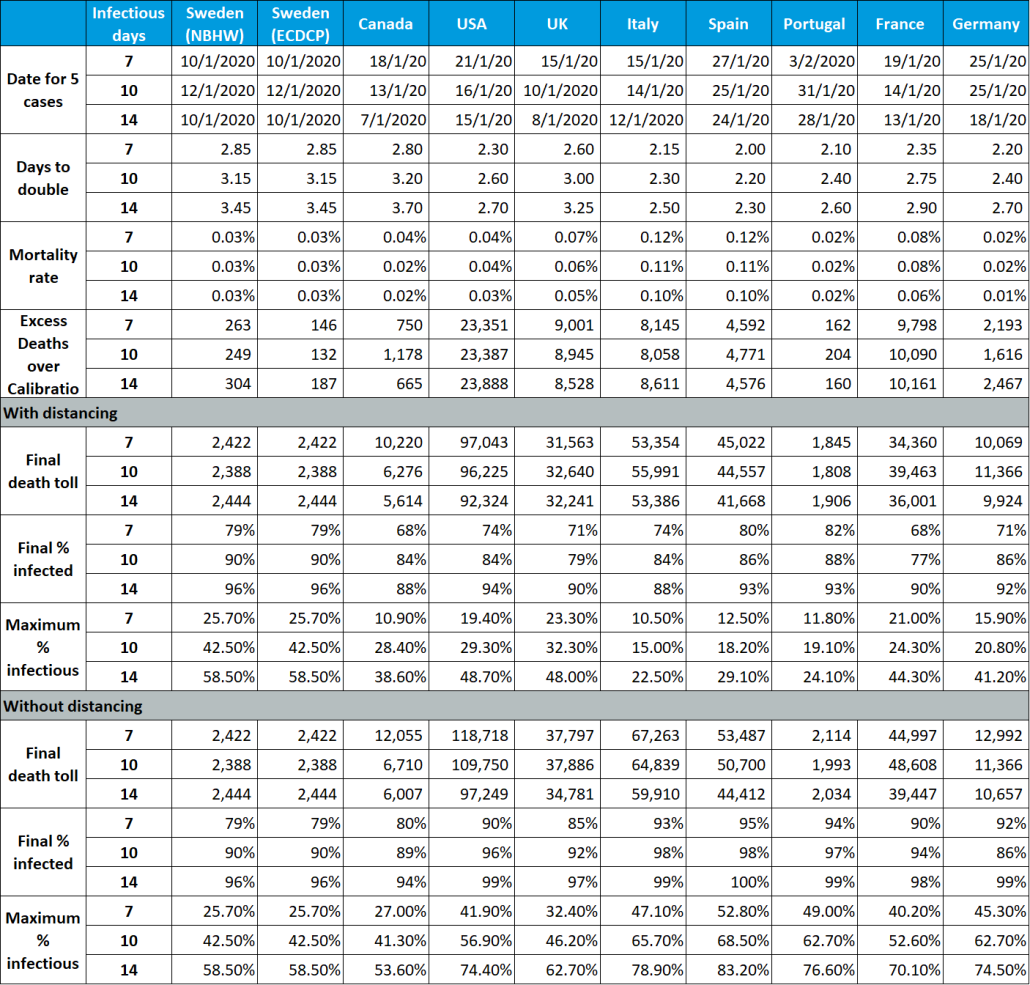
I thought I should do some sensitivity for my main (and probably unknowable) unknown, the average number of days that infected people are infectious to others.My initial guess was 10 days, so I also tried 7 and 14 days. I also added the actual dates when distancing measures were introduced and tried to match those too (not always successfully). The table below shows how things turned out, and I am attaching all the corresponding spreadsheets. Overall it seems to have worked well, but calibration was easier for the 10-day infectious period than for the other two, so I think the true value is likely be around 10 days. You will see that Spain and Italy have the highest mortality rates by far, and Germany the lowest.
I think that the good news is that current phase of the epidemic will be over quite quickly now, but with most of the population having been infected and no data yet on the duration of any resistance they may have acquired. The large number of unreported cases means that most people are resistant anyway, at least to the current strains of the virus. That doesn’t apply to countries that have managed to control the outbreak, like New Zealand, Iceland, Taiwan, South Korea and, maybe, Singapore. Whereas, come the Summer, almost everyone in Europe and North America will have been infected and recovered, so the need for travel restrictions should disappear (never mind the US pause in issuing Green Cards), these countries will have to maintain strict quarantine and testing regimes for everyone entering the country, to prevent new infections.
Download the updated model here.