
[This post first appeared on World Bank Blogs on June 3.]
A recent blog by Stéphane Hallegatte and Stephen Hammer has already generated debate about how to undertake pandemic recovery stimulus packages in ways that support ongoing momentum toward a decarbonized world. This piece builds on that analysis, focusing on the role of the power sector.
Governments failed to anticipate how to prepare their economies and public health systems to weather a storm like the coronavirus (COVID-19). As such, the cost of the crisis and the subsequent recovery is enormous. We had in effect to stop the global economy so that health systems could cope. It is crucial not to fail again, whether to avert the next pandemic or the “mother of all crises” posed by climate change.
It’s well understood that the impending, massive fiscal stimulus packages will be an opportunity amounting to trillions of dollars. If this chance to avert the climate crisis is missed, it may never come again. But how best to seize the opportunity?
Here are important lessons in four key areas:
- Policies for clean energy. Supportive policies have achieved a lot in spreading deployment of clean energy, reducing unit costs through global economies of scale and accelerating the learning curve. Policies have included, for example, the use of auctions for clean energy procurement to minimize the need for subsidies. The next phase of reforms might focus on ensuring that market structures and regulations provide remuneration for investments in energy storage, to offset the variability of solar and wind.
- Costs of clean energy. Another key lesson is that the sooner a clean technology can graduate from needing subsidies, the better. There have been too many examples of subsidies being suspended during fiscal crises, making investors not want to rely on them indefinitely. One important difference in the situation today, versus recovery after the 2008 global financial crisis, is that there are now cost-competitive renewable energy technologies. Subsidies should be refocused on the technologies that are new and promising, and that can take decarbonization to a new level (e.g., flexible power solutions, such as demand responsiveness or energy storage).
- Security of energy supply. Variable renewable energy can replace fossil fuels up to certain level of penetration in a power system, but it will eventually reach a limit, affecting the security of electricity supply. At that point, flexible power solutions need to be in place to enable cheap variable renewables to continue to penetrate the system.
- Financing for clean energy. Experience shows that early investments in clean energy technologies need financing that is on less than commercial terms, to enable a demonstration and replication effect. That is precisely what the special funding mechanisms I describe below are for. They are particularly useful when it is possible to involve private investment and support it with a blend of commercial and concessional finance.
So, drawing on these lessons, here is a suggested solution, in which the World Bank Group and Climate Investment Funds could provide leadership:
- Governments could use quick-disbursing development policy operations (DPOs) from the World Bank and other multilateral development banks (MDBs) to support policy reforms that enable clean energy investments to be a key component of economic recovery. Countries’ National Determined Contributions (NDCs) would in many cases provide a “ready-made” policy framework.
- Investors could start preparing investment projects for support, when “shovel-ready”, from the Climate Investment Funds (CIFs) and Green Climate Fund (GCF). These investments could be an important component of fiscal stimulus packages, creating income and employment directly, while also helping provide the cheap energy needed to drive economic recovery.
- Donors could ensure that climate action constitutes an important part of the development financing from MDBs for the COVID-19 recovery effort. This would require that resources in the CIFs and GCF scale up proportionately to the development financing effort from MDBs. Donor decisions about this need to start being made, and they would greatly facilitate the preparatory international discussions leading up to the UK-hosted COP26 climate negotiations next year. This may be how Glasgow succeeds where Madrid did not.
So, we should scale up DPOs now based on countries’ NDCs, get investment projects shovel-ready, and replenish the CIFs and GCF on a scale commensurate with the size of the challenge. With these approaches, much could be achieved towards averting the next crisis. It’s only really a matter of the political will to do it, and the insight to recognize that not doing so invites catastrophe. The pandemic makes clear that we must be visionary in our planning if want to reduce our vulnerability to future shocks.
About the Author: Jonathan Walters is a Senior Advisor at Castalia.
 Image by
 As New Zealand implements further relaxation of lockdown restrictions it is timely to consider what optimal pandemic response strategies are, in light of experience in the antipodes, and how they might be evaluated.
NZ has suspended the normal process of quality evaluation of regulatory impositions via its Regulatory Impact Analysis (RIA) process for the duration of the crisis. The Regulatory Impact Statement (RIS) is a document that should, in plain English, describe the regulatory decision that is to be made with enough detail to enable a non-expert to understand the decisions and the reasoning.
In this blog we consider some key regulatory trade-offs that have been made in the antipodes when responding to the pandemic. These would be the key considerations when preparing a RIS under normal circumstances.
The stated objectives in NZ and Australia have varied slightly
NZ has pursued an objective of ‘elimination’ while Australia has not overtly sought elimination but rather ‘mitigation’ and ‘suppression’. Recently Australia has added elimination as a possible additional objective.
While stated objectives have varied, an R above 1 has the potential for runaway spread of the virus, so in practice, all of the regulatory responses have sought to control the R below 1 through the sum of controls. An R below 1 results in elimination (and suppression and mitigation). The further below 1 the R is, the faster elimination can be achieved.
A good objective needs to also consider the cost – so an objective of achieving an R significantly below 1 (say 0.5) while minimising costs would establish the appropriate trade-offs inherent in the decision.
Lockdown strategies in NZ and Australia have worked in terms of achieving an R below 1
The approach taken in NZ and all states of Australia is showing clear evidence of working in eliminating the virus – data shows the sum of regulatory impositions has achieved the result of a turnaround in case load growth and an R below 1. This is therefore a collection of ‘successful’ regulatory responses, as measured by the fact that there are no overwhelmed health systems in any of the States, and R is controlled in all cases with minor differences.
Daily caseloads of COVID 19 in New Zealand
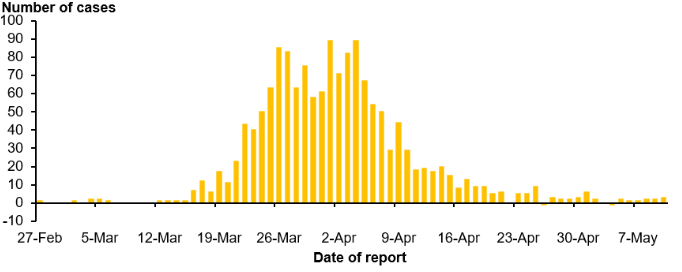
Source: New Zealand Ministry of Health
Australia has reported a similar pattern of daily cases albeit with five times the population of New Zealand.
Daily caseloads in Australia:
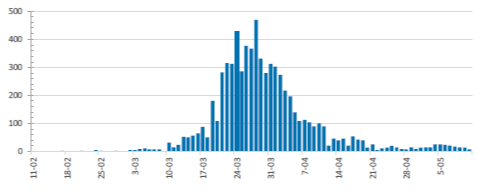
Source: Australian Government Dept of Health
Response strategies have, however, varied in terms of the cost
NZ and Australia have chosen strategies that have many common elements. There are also some differences in approaches. The notable difference is the stricter controls imposed in New Zealand. Most commercial operations were mandated to shut in New Zealand, whereas in Australia this was not generally the case, although there are variations by jurisdiction, and many operated under restricted conditions. New Zealand imposed a four stage alert level and moved quickly into level 4 once the decision to introduce controls was made (see: https://covid19.govt.nz/alert-system/covid-19-alert-system/).
All jurisdictions have followed a broadly similar four step process
These four phases are:
- Impose the regulatory restrictions (border closures, travel restrictions, business closures etc)
- Increase the R effectiveness of the cheapest policies (contact tracing, quarantine, PPE, information dissemination etc)
- Test sufficiently to identify the effective R
- Relax restrictions as appropriate to minimise cost
In our previous blog we introduced a framework where each intervention is lined up according to cost effectiveness and the cumulative impact on R. The sum of the R effectiveness needs to achieve an R below 1 to put the expected caseload on a path to 0 (elimination).
Four phases of policy response to COVID 19
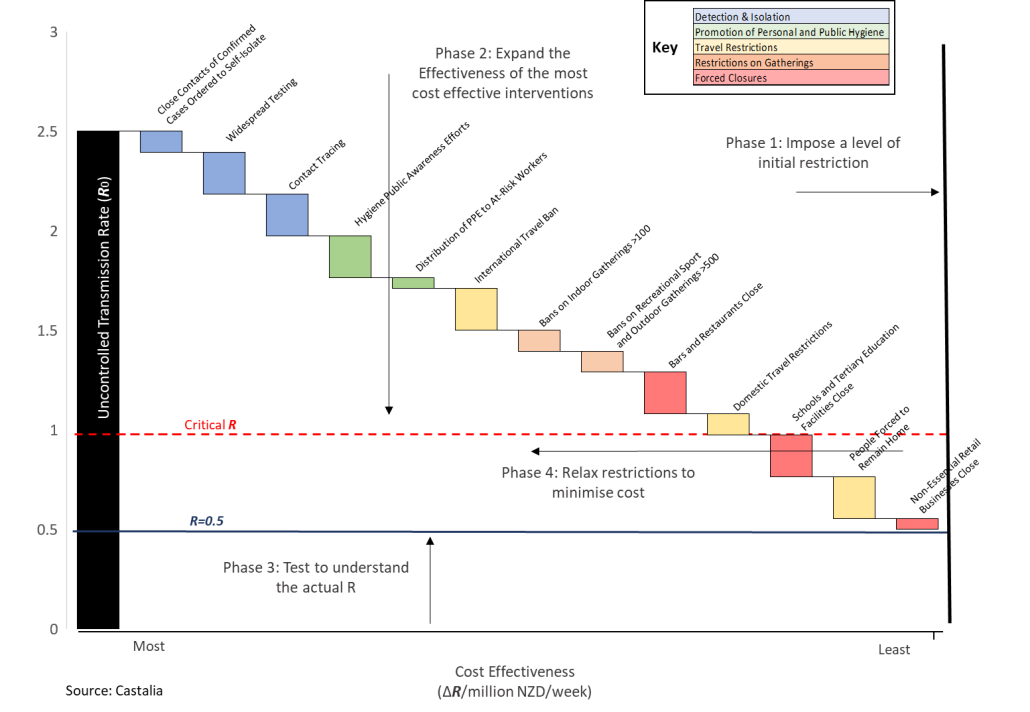
Each intervention has diminishing returns, given the previous ones. Once interventions imposed achieve an R at or about 0.5 additional interventions do not add material incremental value. As the effectiveness of the first interventions are enhanced, there is less opportunity for subsequent interventions to have an impact.
The spread of the virus and the case load when phase 1 is imposed matters in terms of the effectiveness of each intervention. For example, if there are no cases, a border closure alone may achieve near total control of the virus rendering all other interventions ineffective. However, multiple community transmissions across the whole economy might require most of the impositions to control R.
Phase 1: Impose a set of restrictions to control R
The key decision at this stage is when and how many controls to impose in order to manage the R. Similar situations existed in both countries prior to phase 1 in terms of caseloads, however, New Zealand had a higher growth rate of the virus (371% compared to 122% in Australia).
Neither country-imposed restrictions quick enough to consider light controls (such as border closure and quarantine alone). All jurisdictions imposed restrictions in a phased manner albeit with little time between phases.
NZ chose to impose more significant restrictions than all jurisdictions of Australia. The extent of business closure in NZ was more significant, including notably construction and food services deemed non-essential including fast food, cafes and the like.
The Australian approach does not line up exactly with a Level 3 approach in NZ partly because responses varied by jurisdiction in Australia but in all cases the response was more like a Level 3 than a Level 4 under the New Zealand typology.
Hindsight is a wonderful thing
In hindsight it might be easy to conclude that the impositions in NZ were not least cost, since lighter restrictions in Australia have proved to have cumulatively reduced R to similar levels.
There are two reasons why a stronger set of impositions in NZ might have been necessary to control the virus:
- If the risk assessment at the time of imposition viewed the capability of phase 2 as significantly lower in NZ (contact tracing, health sector capability, essential service practices etc)
- If the situation at the time of intervention was not similar
What is the additional cost of tighter restrictions?
The relative impact of a ‘Level 3’ lockdown compared with a ‘Level 4’ lockdown in New Zealand has been modelled by the Reserve Bank of New Zealand. There is a significant additional cost impost (measured by GDP alone[1]) with tighter restrictions.
NZ GDP by Industry during levels 3 and 4 (as a percentage of pre coronavirus level):
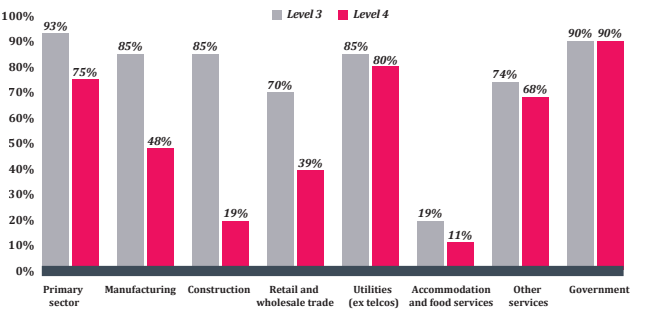
Source: RBNZ
The Australian RBA has not made a directly comparable analysis but they have assessed the changes in employment over the first month of lockdown (broadly comparable to a Level 3 lockdown in New Zealand).
Changes in jobs by industry in Australia during Lockdown:
Source: ABS
Phase 2 and 3: Enhance the effectiveness of the most cost-effective responses
All jurisdictions have aggressively ramped up their best responses to maximise the R effectiveness and understand the actual R in the community.
There is little difference across all jurisdictions in phase 2 and 3: a focus on contact tracing capability, testing capacity, stricter quarantine conditions and the distribution of PPE equipment have all been pursued to relatively high levels (globally).
Testing rates per thousand in Australia and New Zealand:
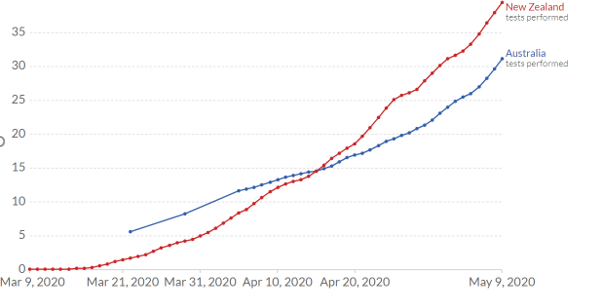
Source:’ Our World in Data’ from official sources
Australia has reported a similar rate of testing to New Zealand with over 855,000 tests undertaken to date (Australian Dept. of Health).
All jurisdictions have reported similar increases n contact tracing capacity and capability.
Phase 4: Relaxation of restrictions
A progressive relaxation of restrictions is currently occurring or being contemplated across all jurisdictions.
If Phase 2 and 3 are effective, the stricter interventions become redundant as the target R is achieved with the more cost-effective interventions, thus enabling a relaxation of controls.
This phase is still in progress across all jurisdictions. New Zealand has announced a relaxation to level 2 from May 13, two weeks after a relaxation to 3 from four weeks at Level 4. Level 2 allows for the ‘safe’ re-opening of most commercial operations and educational institutions while requiring social distancing and limits on the number of patrons in hospitality operations. Australia is contemplating easing of restrictions also, albeit from a position of lesser restrictions. A three-step plan to relax all restrictions is currently proposed across Australian states by July[2].
Is there a dividend from stricter controls?
All of the responses have achieved the first element of the objective by controlling the R of the virus in remarkably similar fashion. If the starting risk position was similar, then differences in response can be evaluated through relative cost.
A key question is whether there is a dividend from the additional restrictions in New Zealand. This is not entirely clear yet, but a dividend could be realised in two ways:
- an earlier exit from restrictions, or,
- more effective control of the virus and a reduced risk of subsequent need to reimpose restrictions
A dividend from an earlier relaxation would need to more than outweigh the additional costs already incurred from the four weeks of additional restrictions. This is approximately 15% of GDP according to the Reserve Bank of New Zealand for the period spent at Level 4 compared with the alternative of four weeks at level three. These traded costs are not the entire economic cost however and if nontraded impacts were counted the number would be far greater, but, the costs incurred already from tighter restrictions are approximately 4 billion.
A dividend from better virus control will become apparent over the course of the next few months should Australia turn out to have a less controlled outcome.
If the starting risk positions were not similar, then the value of stricter impositions will be harder to ascertain. The only evidence that they were not similar is the higher reported growth rate in New Zealand prior to regulatory action. These are not the most reliable numbers as testing was not widespread at that stage and New Zealand had a more concentrated number of ports into the country.
[1] Traded activity measures do not capture the entire economic cost of restrictions
[2] See https://www.health.gov.au/sites/default/files/documents/2020/05/3-step-framework-for-a-covidsafe-australia-3-step-framework-for-a-covidsafe-australia.pdf for a description of the three stages in Australia
Image by Fernando Zhiminaicela
About the Authors: Dylan James is a Director in Castalia’s Wellington Office
Dylan.James@castalia-advisors.com
Disclaimer: The views expressed are those of the authors alone. This work has not received funding from any other organisation or interest.
 https://pixabay.com/users/geralt-9301/?utm_source=link-attribution&utm_medium=referral&utm_campaign=image&utm_content=96863
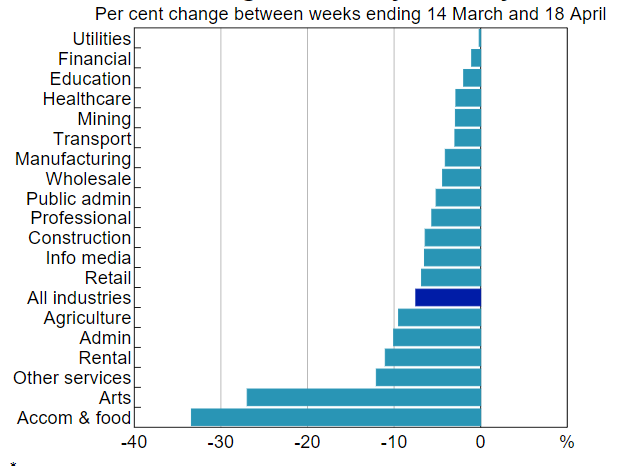
Electricity plays a critical role in the fight against the COVID-19 pandemic. It is an essential service that powers hospital, homes, and businesses. In the long run, provision of reliable and affordable power will play a key role in the immense economic recovery that will be needed in the wake of the pandemic.
In the short run, the current economic downturn has both lowered electricity demand and reduced many people’s ability to pay their bills. This has disrupted cashflows in electricity systems across the globe. Transmission and distribution sectors have been particularly negatively impacted, due to challenges related to metering, billing, and collections. Many utilities are now struggling to continue providing quality service, while not being compensated.
To mitigate the effects of decreasing revenues on electricity service providers from reduced demand and lower cash collection, governments are working closely with industry to create policies and recommendations that will enable the continued operation of power utilities. In some emerging economies, international finance institutions (IFIs) have also begun offering much needed support in the form of cash assistance and debt relief.
Castalia is tracking how governments and utilities in seven of the countries we work in are collaborating in response to COVID-19. Table 1 below summarizes the responses:
Table 1. Utility responses to COVID-19
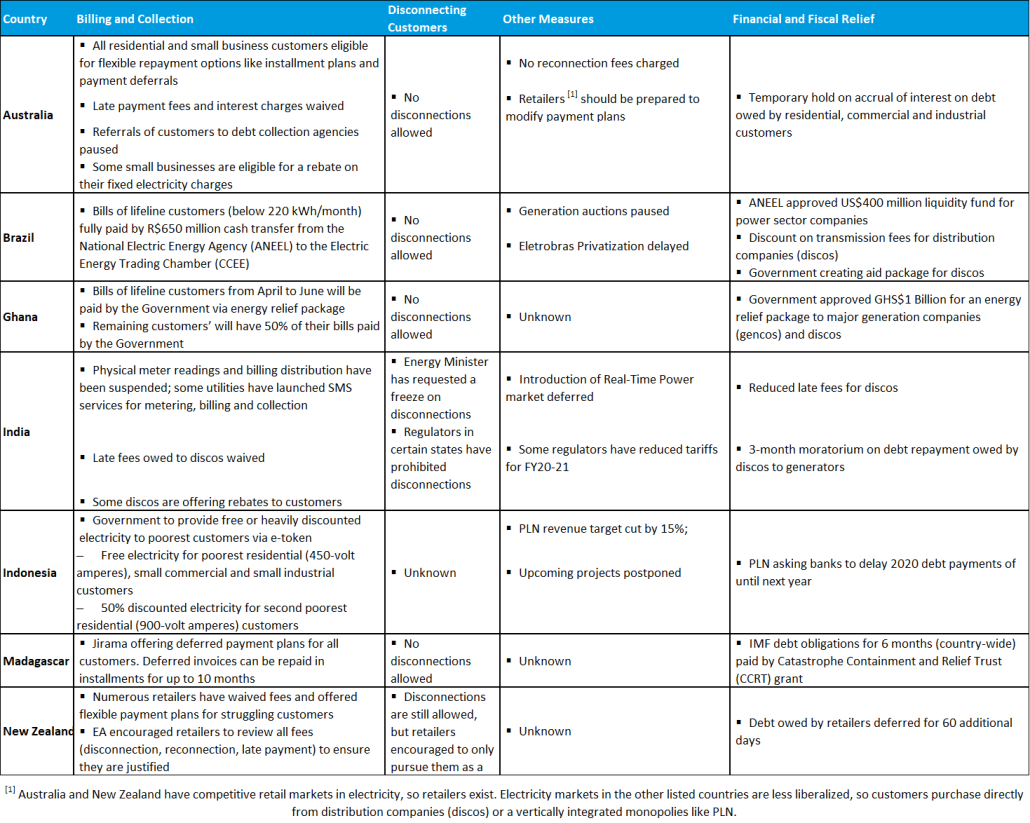 Across the board, governments and utilities have boosted efforts to increase flexibility in billing and collections. In the developed countries we analyzed, governments have either encouraged or mandated utilities to provide the option of installment plans or payment deferrals for customers who are struggling financially. In contrast, some governments in developing countries have taken a more radical approach of paying the electricity bills of the poorest customer groups. This protection of the most impoverished is laudable but could create additional fiscal strain on some of these governments.
Another almost universal trend we noticed was that distribution companies (discos) and retailers are suspending disconnections for customers who cannot afford to pay their electricity bills. The Australian Energy Regulator (AER) has explicitly barred retailers from disconnecting any residential or small business customers. A similar order was announced by the Tripura Electricity Regulatory Commission (TERC), but it is the only explicit regulatory mandate in India. However, this New Zealand is the only country we studied that still allows disconnections. However, the Electricity Authority (EA) has strongly encouraged retailers to only pursue this action as a last resort.
Governments and IFIs have also been stepping up financial and fiscal support. We observed that developed countries have implemented lighter fiscal intervention compared to developing countries. For example, Australia and New Zealand have slightly loosened restrictions on debt owed by electricity sector participants. Interest on debt owed is not accruing in Australia and retailers in New Zealand have an additional 60 days to repay debt obligations. Conversely, Brazil has introduced a US$400 million power sector liquidity fund and the Ghanaian Government approved a GHS$1 billion (~US$170 million) electricity sector relief package. For Madagascar, some fiscal relief has been provided by the IMF, through a US$166 million disbursement through the Rapid Credit Facility (RCF) and six months of debt service relief from the Catastrophe Containment Relief Fund (CCRF).
With the end of the pandemic not yet within sight, and a massive global economic recession looming, we believe that governments and IFIs will continue to play a critical role to ensure that utilities are able to deliver electricity while managing significant cashflow shortages.
We will continue to track developments in the countries we work in and share them on this blog.
Authors: Lisa Tessier, Will Mulhern, Gianmarco Servetti
Sources for Table 1
Australia, Department of Industry, Science, Energy and Resources, Energy Network, Government of Australia
Brazil, IJGlobal, Reuters, Reuters, KPMG, ANEEL
Ghana, BBC, Pulse, AllAfrica, ECG
India, Bloomberg, IW, Contact Center, Mercom, The Economic Times, The Free Press Journal
Indonesia, Jakarta Post, Jakarta Post, Jakarta Post, Reuters
New Zealand, Government of New Zealand, Electricity Authority