
Clive Harrison has updated his spreadsheet-based pandemic model that was posted on this blog on April 22.
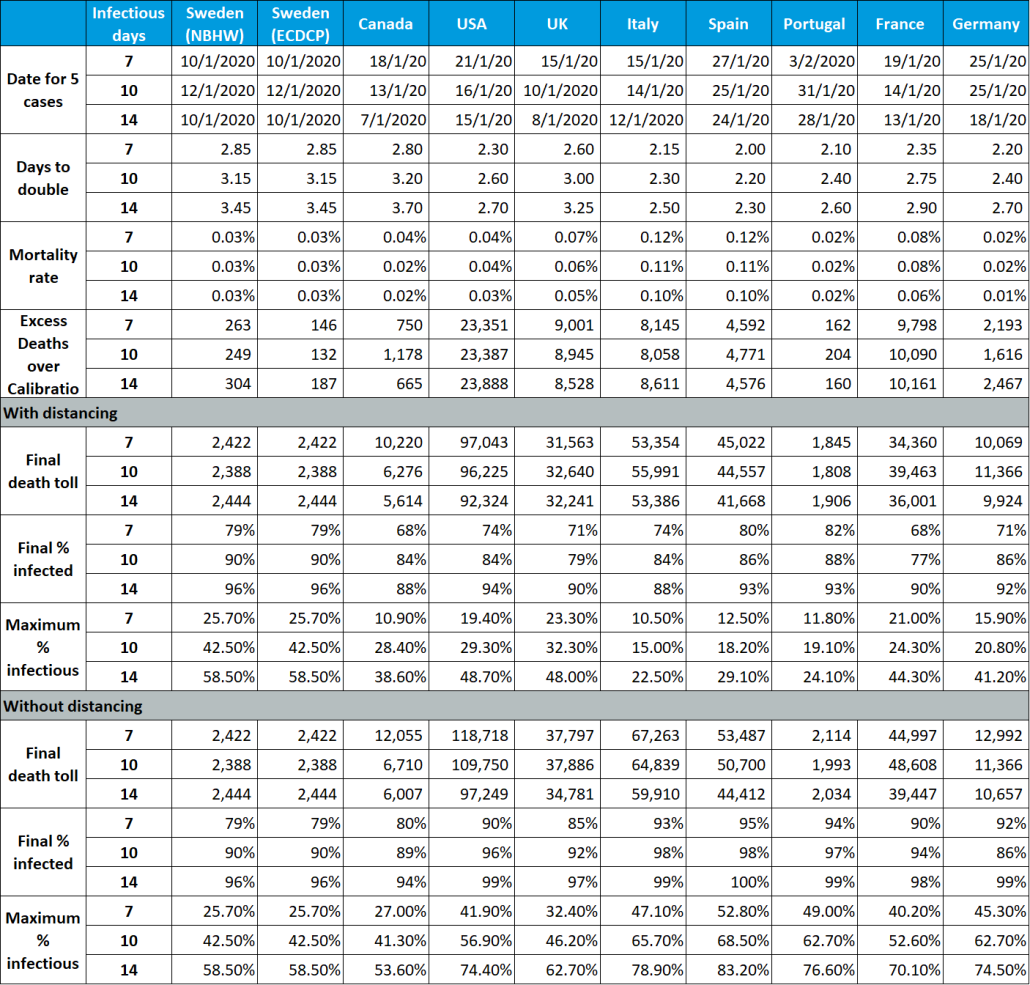
Download the updated model here.

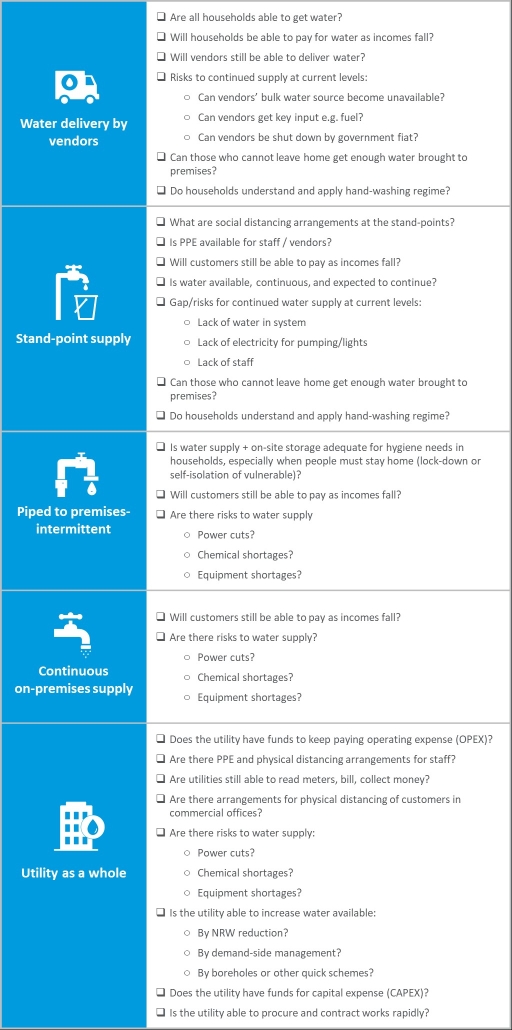
Water providers are on the front line fighting COVID19. Everyone needs water for hand-washing. People who are locked down or self-isolating need water at home. Yet in many places, water supply arrangements create risk. Groups gathered around a standpipe or water kiosk can quickly spread infection. So can water vendors going door to door. Water utility staff need protection from infection, in customer service offices, and when working with colleagues on operations and maintenance. Even worse, as economies grind to a halt, customers stop paying their bills. Without cash coming in, how can utilities pay salaries, and for the electricity that keeps the water pumping, and for the chemicals that make it safe?
To help utilities see clearly in this maelstrom of risk, we’ve created a Risk Identification Checklist. It delineates between risk categories: risks for communities that rely on water vendors, risks for those who use standpipes, risks for other customer groups, and finally risks that threaten a water utility’s overall ability to function. With this simple checklist, a utility or government can quickly identify where its big risks are—which is the first step in planning to respond to them. Please use this checklist. Let us know if it’s helpful. Please suggest improvements. Finally, if you need help in planning your response to the risks, let us know too – we may be able to help.
Author: David Ehrhardt
 https://pixabay.com/photos/laptop-business-man-from-above-2838918/
Governments around the world are shutting down businesses to slow the COVID-19 pandemic, while simultaneously trying to maintain employment and prevent widespread business bankruptcies. This post contrasts government responses in the five countries in which Castalia has offices: the USA, Australia, New Zealand, France and Colombia. Government responses fall into two main categories: business continuity programs (business loans) and employee protection programs (wage subsidies).
Table 1 summarizes what each country it doing to keep small and medium enterprises afloat during the crises. All five governments have instituted loan guarantee programs. These programs differ markedly in eligibility requirements, amount of the loan, extent of government guarantee provided, and whether the loans can be forgiven.
Table 1: Business Continuity Programs
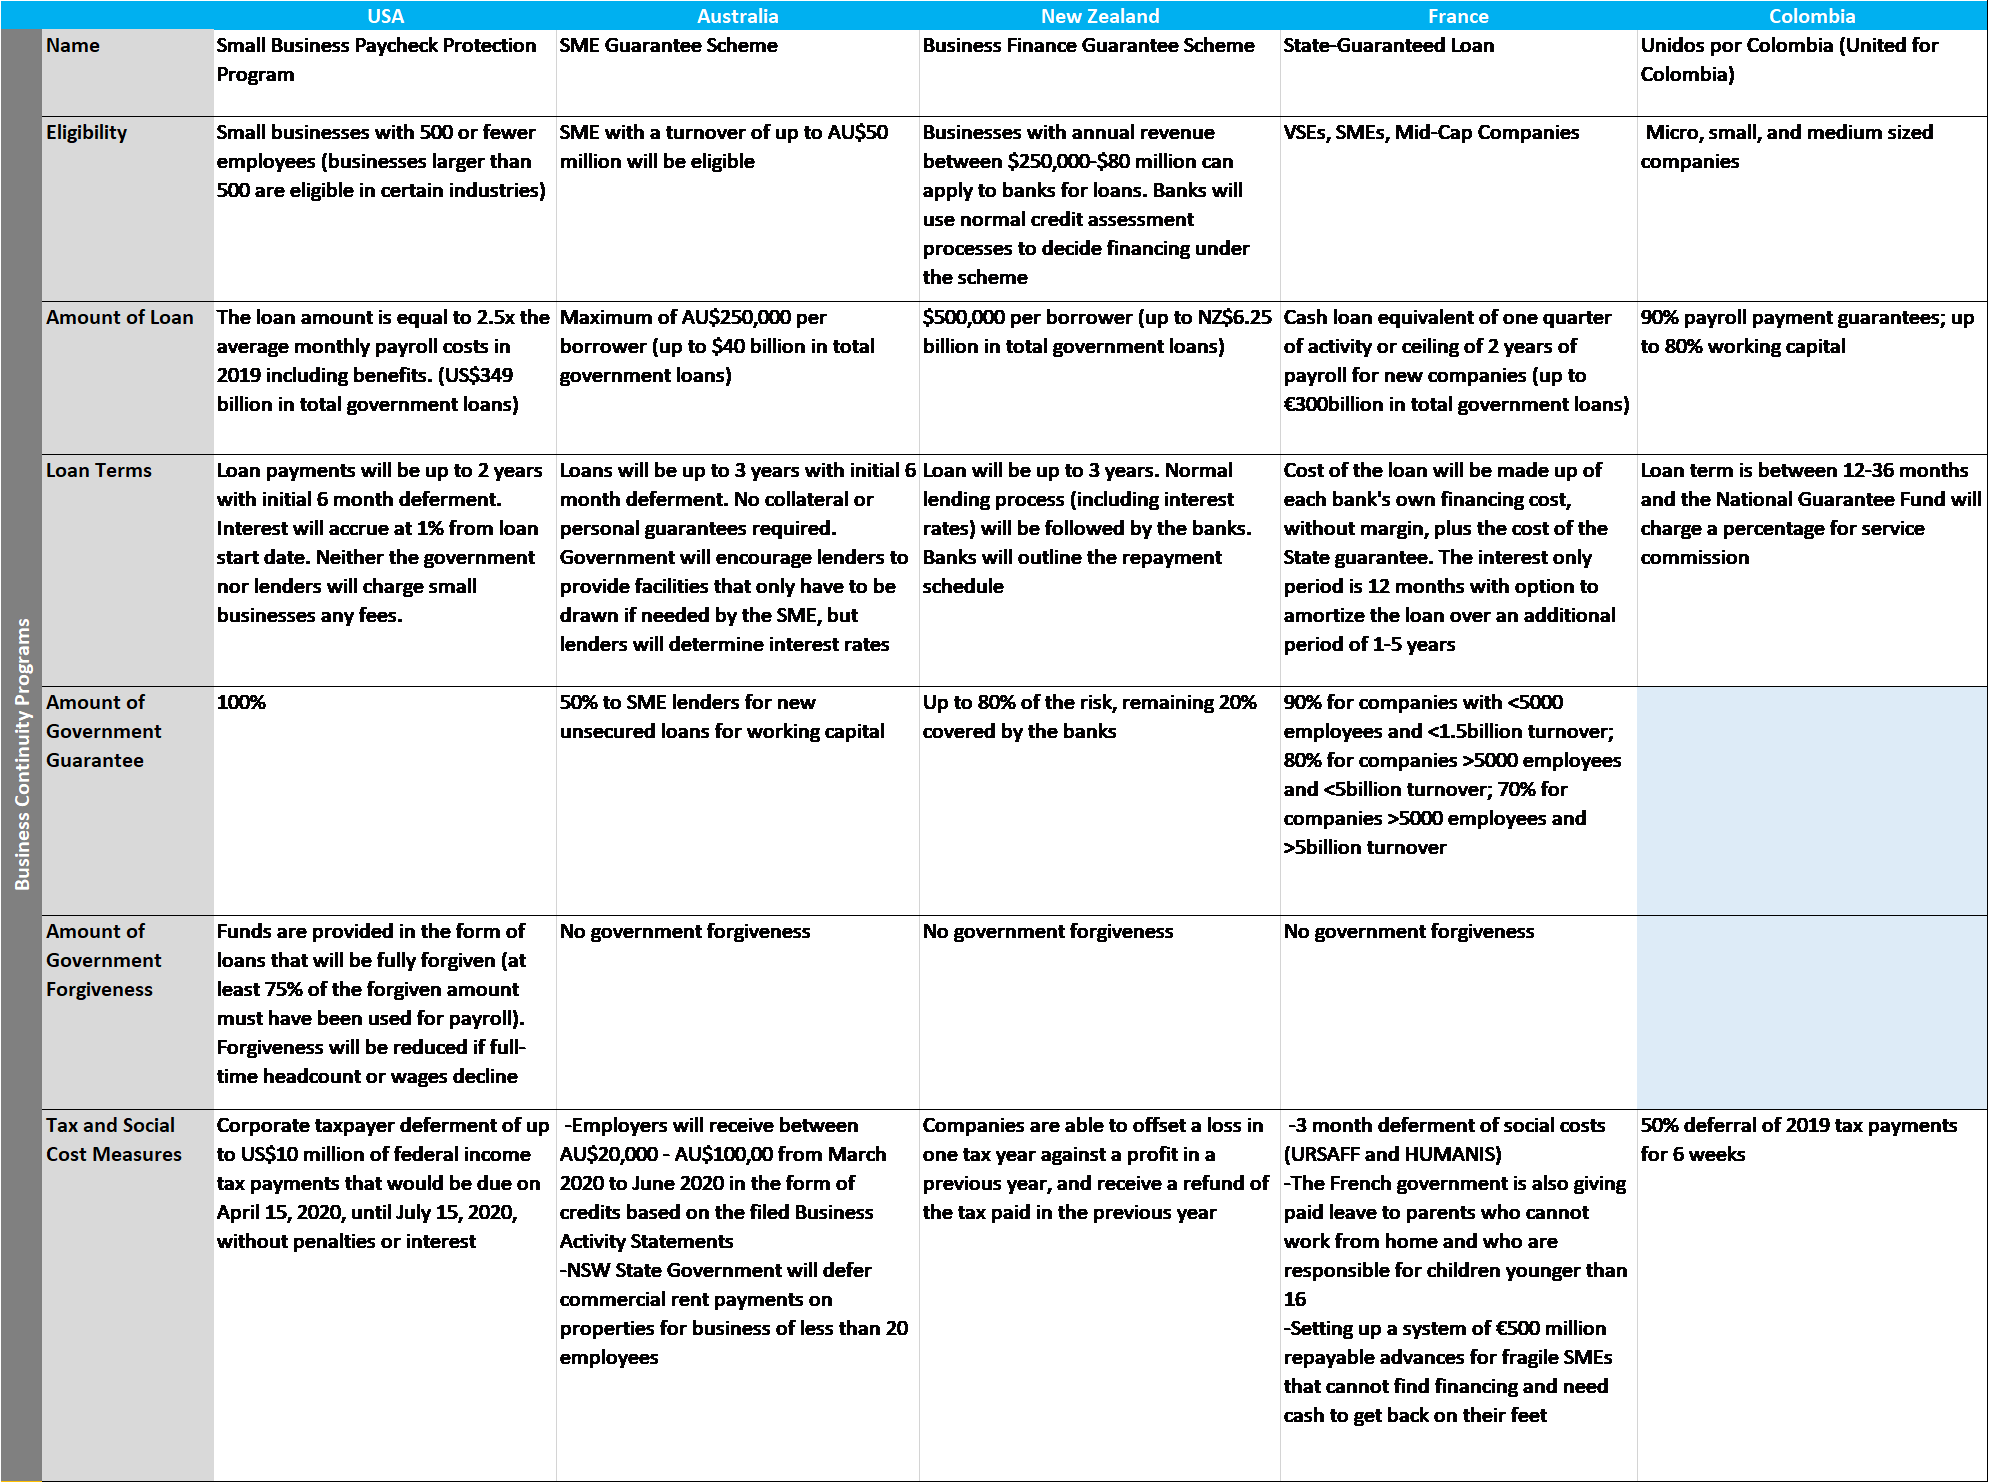
The United States is the only country offering a 100 percent government guarantee on the loans. Governments in France and New Zealand will guarantee 90 percent and 80 percent of the loan, respectively, while Australia only offers a 50 percent government guarantee.
The higher the government guarantee on offer, the more likely banks are to lend to businesses that would otherwise go under – but the higher the fiscal costs when businesses which borrowed go bust. The US approach mandates that banks forego normal lending criteria. This is made commercially possible by the 100 percent guarantee protecting banks if businesses do go under. In contrast, while the New Zealand government has guaranteed 80 percent of the loan value, the Reserve Bank of New Zealand has instructed banks to continue to apply normal commercial lending criteria. This means that companies at risk of failing are not eligible for the loans. (It is not clear if this is deliberate or a misalignment between the government and the central bank.)
Turning to funds committed, France leads the pack, with government guaranteed loans totaling nearly 12 percent GDP (€300 billion).[1] In contrast, financing for business continuity programs in the US, New Zealand and Australia all equate to roughly 2 percent of GDP. New Zealand’s commitment of 1.84 percent of GDP (NZ$6.25 billion) to the Business Finance Guarantee Scheme is in line with Australia’s 1.78 percent of GDP (AU$40 billion) contribution to the SME Guarantee Scheme, and slightly more than the United States’ original commitment of 1.70 percent of GDP (US$349 billion) to the Small Business Paycheck Protection Program (‘PPP Loan’). Many countries have already pledged additional funding, so these figures are fluid.
Government programs aimed at keeping workers in employment are summarized in Table 2. In Australia and New Zealand, firms experiencing a 30 percent (or greater) drop in revenue due to COVID19 can receive a subsidy of AU$750 or NZ$585 per employee per week, respectively. Rebates of payroll taxes, and employer-deducted income tax, are also on offer.
In contrast, the US has created a wage subsidy scheme by offering up to 100 percent forgiveness of loans taken out under the business continuity (PPP) scheme, provided that at least 75 percent of the loan proceeds are spent on payroll costs. Businesses that get the loan may have up to two months of payroll costs covered by the government. The US approach has been to minimize paperwork, meaning there is no requirement for businesses to show they have experienced a reduction in revenue because of COVID19 to get the PPP loans and subsequent loan forgiveness.
Table 2: Employment Protection Programs
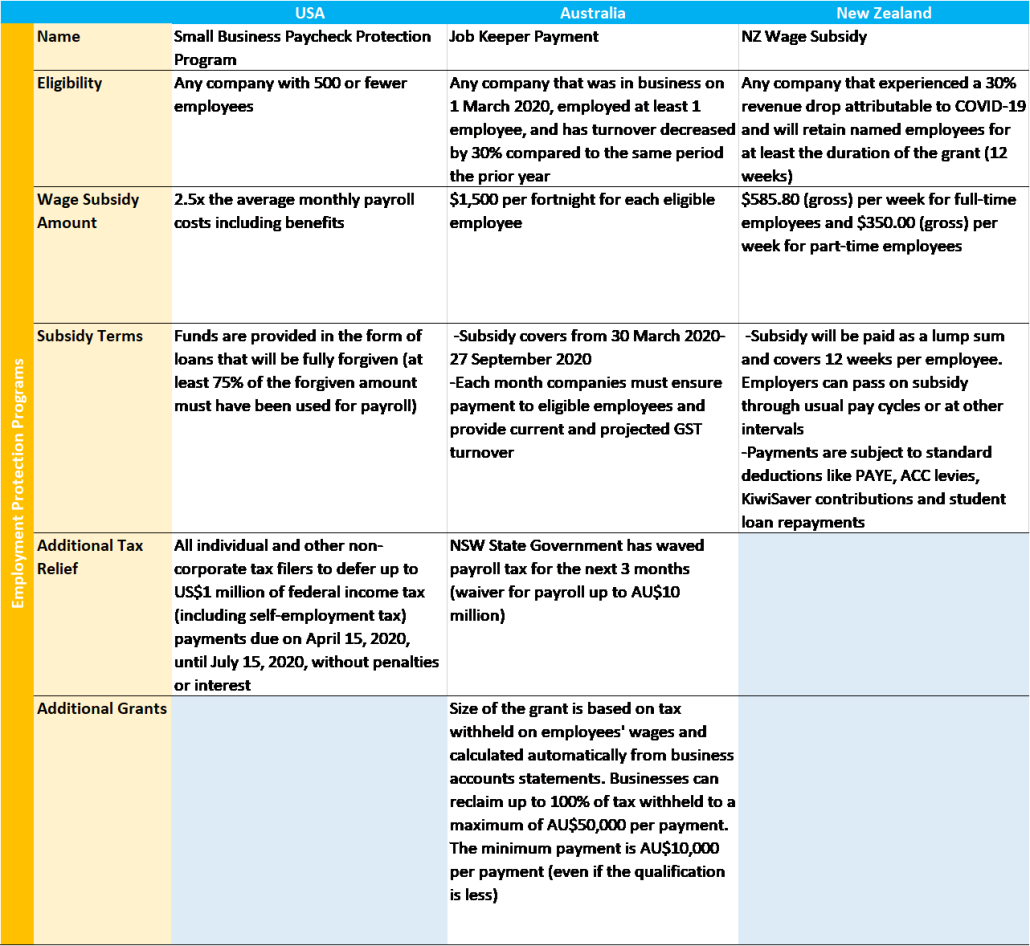
Commitments to the wage subsidy program vary significantly. Australia has pledged the most—nearly 6 percent of GDP to finance wage subsidies. New Zealand has committed approximately 3 percent of GDP, and the United States has promised just 1.70 percent of GDP to the PPP loan forgiveness (wage subsidy) program. Although there are many factors at work, it is interesting to note the growth of unemployment without direct wage subsidies. The rate of unemployment in the US is projected to soon reach 17 percent [2], significantly higher than Australia and New Zealand, which are both estimated to reach 10 percent[3][4] this quarter.
Authors: Morgan Kellman and David Ehrhardt
Photo by Lukas Bieri
[1] Calculations generated using 2018 GDP data from https://data.worldbank.org/country/. Accessed 27 April 2020.
[2] https://www.cnbc.com/2020/04/26/coronavirus-hassett-says-unemployment-will-approach-great-depression.html
[3] https://www.channelnewsasia.com/news/world/australian-unemployment-rate-to-double-as-covid-19-hammers-12639022
[4] https://www.newshub.co.nz/home/new-zealand/2020/04/coronavirus-new-zealand-could-face-10pc-unemployment-following-covid-19-lockdown.html
Sources for Table 1: https://home.treasury.gov/policy-issues/cares/assistance-for-small-businesses, https://treasury.gov.au/coronavirus/sme-guarantee-scheme, https://www.smartcompany.com.au/coronavirus/covid-19-stimulus-state-guide/, https://www.bnz.co.nz/contact/covid-19-update/business-finance-scheme, https://www.bloomberg.com/news/articles/2020-03-16/france-to-put-all-reforms-on-hold-to-focus-on-virus-macron-says, https://www.fng.gov.co/ES/Paginas/Unidos_por_Colombia_FNG.aspx
Sources for Table 2: https://home.treasury.gov/policy-issues/cares/assistance-for-small-businesses, https://www.ato.gov.au/General/JobKeeper-Payment/, https://www.employment.govt.nz/leave-and-holidays/other-types-of-leave/coronavirus-workplace/wage-subsidy/#eligibility