 Image by
 Both Australia and New Zealand have initiated unprecedented social and economic restrictions in response to COVID-19, and both appear to be about equally successful at bringing the epidemic under control. However, while the lockdowns in the two countries may look similar, they are in reality quite distinct in terms of their restrictions on economic activity and lifestyles. What can both countries learn from the differences in their approaches and what does it mean for a possible gradual removal of restrictions?
The New Zealand Government commenced self-isolation policies on 25 March 2020 with restrictions that focussed on confining people to the household unit (or “bubble”). Australia progressively escalated its restrictions, with a key lockdown announcement on 29 March 2020 directed at limiting activities where congregation of people occurs.
The Australian State and Federal governments, as well as New Zealand’s government will face choices about whether, for how long and to what extent to continue with lockdown policies. The wellbeing impacts of the lockdown are large, even if difficult to measure right now. On one hand the policies appear to be limiting the spread of the disease. On the other hand, there are a range of other impacts on welfare.
From this comparative analysis, Australian policies appear, on the limited evidence, to be effective with fewer negative impacts on wider wellbeing. Australia also appears better placed to rebound when restrictions are lifted. New Zealand’s policies have contained people to household “bubbles” with consequential impacts on activity such as work and education. New Zealand may have more difficulty rebounding.
The States and New Zealand are good comparators because all have similar urbanisation rates (between 86 and 90 percent), demographic profiles, cultures and legal systems.
Different Approaches to Lockdown in Australian States and New Zealand
New Zealand has a unitary government. Each Australian State is responsible for implementing its own set of rules. However, the public health directives implementing the restrictions are all very similar. There are differences between the States’ policies (for example, golf is permitted in New South Wales, but not Victoria), however, the general approach to workplaces and activities is the same.
With this in mind, while the headlines sound the same—Australia and New Zealand in lockdown—there are important differences between the two countries.
In summary, while borders are generally closed:
- Australia’s restrictions are activity based. Activities are limited where people can randomly encounter one another, but most workplaces are able to continue operating subject to compliance with social distancing rules
- New Zealand’s restrictions confine each household to their own “bubble”. Leaving home is only permitted for acquiring essential items and for exercise. A limited set of essential services and businesses may continue.
The table below draws out the differences in more detail.
Table 1: Lock-down Policies in New Zealand and Australian States
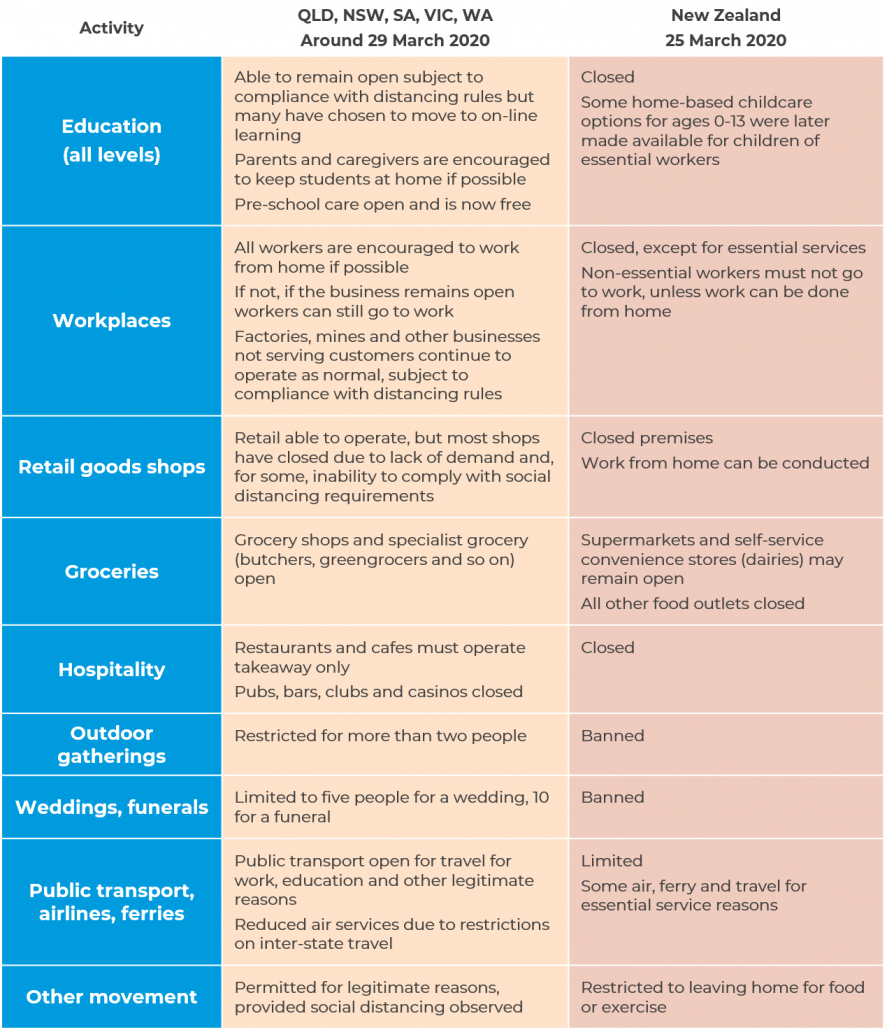
Source: Castalia
Australian “activity-based” approach allows a wider range of activity to continue
Australia’s lockdown approach substantially reduced activities which involve large number of random interactions between individuals (in bars, restaurants, entertainment and sports venues) but largely left the economy free to operate subject to compliance with guidance about workers keeping social distance.
This means businesses can still function, even if in a low-level holding pattern. For example, even if a business is closed (for example, a pub) business owners can visit the premises to maintain equipment or catch up on paperwork. Employees can go to work, unless they are able to work from home.
Australia has allowed continued interactions between people in workplaces and education facilities. However, these are largely controlled settings: factories, construction sites, schools, tertiary education institutions. This means that employers (and if need be public health officials in case of an outbreak) know who is interacting with whom. Workers sign in and attendance rolls are usually kept. Interactions between people can be structured and rule bound.
New Zealand’s “bubble” approach constrains more activity
New Zealand’s household “bubble” approach limits all economic activity to essential services and work that could be done from home. All non-essential business that cannot be carried out from home has stopped. Essential businesses are those essential to the provision of life and the businesses that support them. For non-essential workers, this means that leaving the home is forbidden except for attending to essential business (buying food, seeking medical help or supplies, outdoor exercise near the home).
The effect has been to shut most customer facing SMEs. All retail except supermarkets and convenience stores are closed. Limited exceptions have been progressively made as the lockdown goes on (for example, modestly expanding the definition of essential goods, permitting groundskeepers to maintain turf).
The policies have had major implications for supply chains. Since essential items may only be sold, logistics has become more complicated. The food supply chain had to rapidly change since now almost all food is distributed through two supermarket chains, rather than wholesalers, specialist shops and cafes or restaurants.
2 Similar Epidemiological Results
On raw data, most Australian States have had a lower rate of COVID-19 spread than New Zealand. New South Wales has had the highest rate of COVID-19 spread of the six jurisdictions, followed by New Zealand and South Australia. Queensland, Victoria and Western Australia have had a similar rate of disease spread. Policymakers should be pleased that the spread of the virus is being contained, as the number of new cases decreases. Allowing for uncertainties around testing and the small numbers involved, we could generally conclude that all Australian States and New Zealand have achieved broadly similar COVID-19 outcomes.
In Figure 1 below shows the rate of infections from the point in time that 5 cases per 1 million population were recorded in each jurisdiction. The disease appears to have arrived around two weeks later in New Zealand, so starting all jurisdictions from the same point is useful for comparison purposes. The chart shows a more rapid increase in cases in New Zealand, despite the earlier and more restrictive rules.
Figure 1: COVID-19 Cases per 1 Million Population Since 5 Cases per 1 Million
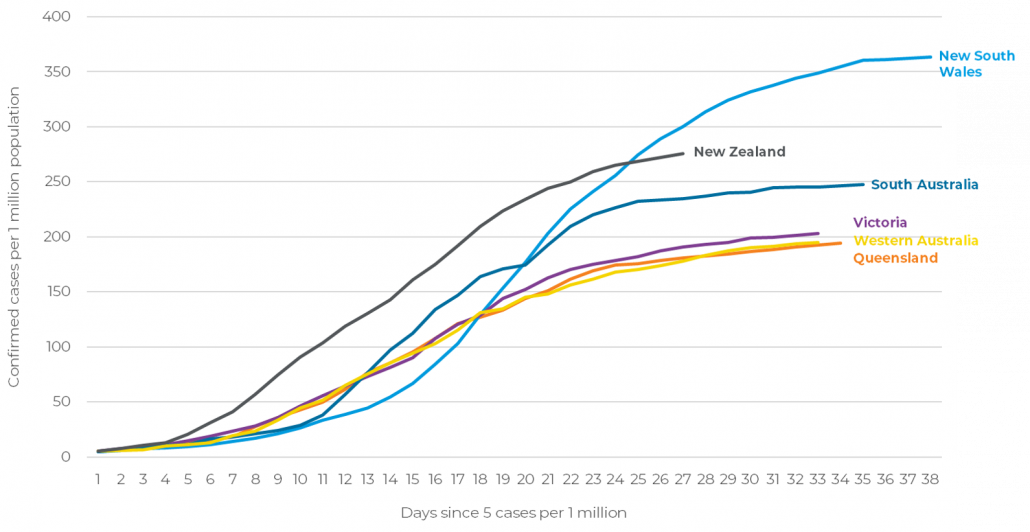
Source: New Zealand and State government announcements
Note: Current to 14 April 2020
All the States and New Zealand have seen a flattening of the epidemiological curve. Figure 2 shows the rate of increase of confirmed cases since lockdown policies were implemented. It is likely that lockdown policies have played an important role, in addition to other factors (for example demographics, climate, other behavioural responses).
Figure 2: COVID-19 Cases per 1 Million Population Since Lockdown Policies Implemented
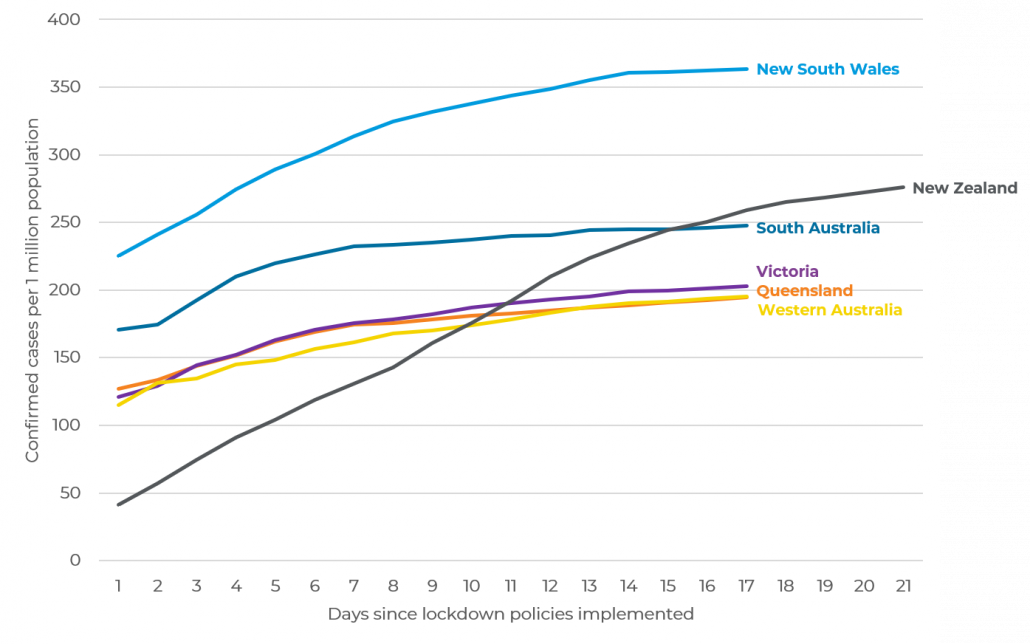
Source: New Zealand and State government announcements
Note: Current to 14 April 2020
Australia has high rates of COVID-19 testing but New Zealand is catching up
The rate of tests for COVID-19 has been high in Australia compared to other countries (for example, higher than South Korea, United Kingdom and United States). New Zealand has now increased its testing rate, but lags behind South Australia and New South Wales. New Zealand had conducted fewer tests per 1,000 population than all of the States until early April (when it matched Western Australia and then Victoria). Figure 3 illustrates this.
Figure 3: Testing Rates for COVID-19 per 1,000 Population
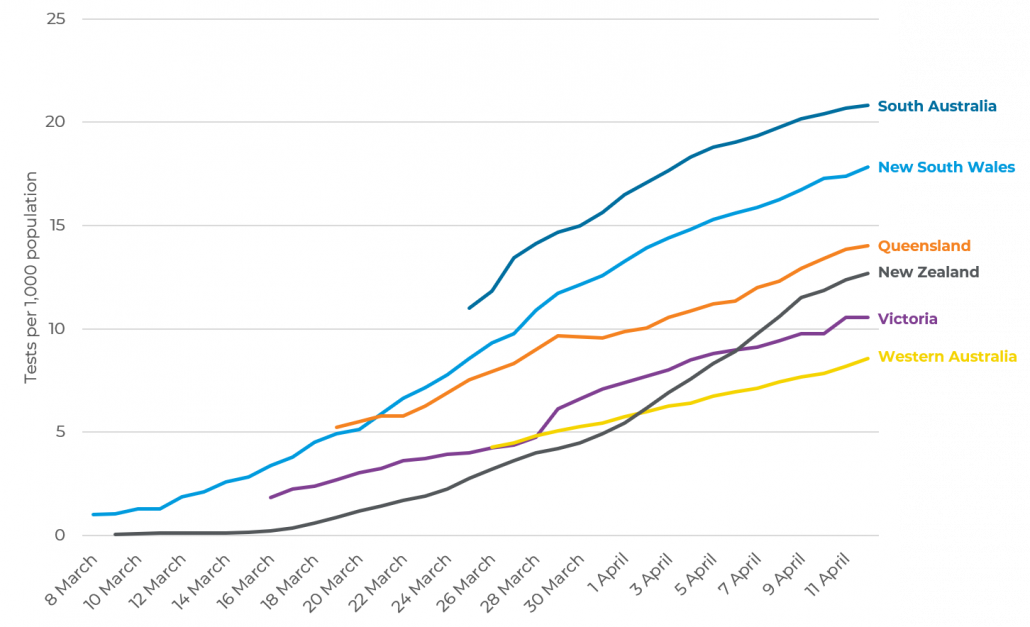
Source: Our World in Data 2020, www.covid19data.com.au
3 Policy Implications from Australia/New Zealand Comparison
Governments on both sides of the Tasman will face choices about the next steps to manage COVID-19. The choices are about whether, for how long and to what extent to continue with lockdown policies. There are trade-offs to make between the epidemiological and health outcomes and impacts on other aspects of wellbeing.
The impacts of the lockdown on wellbeing are intuitively obvious, even if it is difficult to measure some impacts right now. There are the positive impacts of containing the virus (reductions in spread, preventing serious illness and deaths). However, there are also serious negative impacts on other aspects of wellbeing. Shutting down large parts of the economy completely will also make the recovery more difficult.
Australian approach leaves the economy better placed to rebound when restrictions are relaxed
Most Australian States are managing to contain the spread of the disease even with continued controlled operation of businesses and other institutions. It appears from the data in Figure 1, above, that transmission has been slowed. If outbreaks do occur, public health officials can probably more easily track the spread (so-called contact tracing). Workplaces and educational institutions are controlled and structured places, where entry and attendance can be recorded.
Australia seems better placed to recover from the lockdown period. While many businesses have been closed to the public, some ongoing ‘holding pattern’ activity continued. Many other businesses, including SMEs, have remained operational.
This means that when lockdown restrictions can be lifted, Australian businesses will be better placed to rapidly respond to consumer demand. Employees are more likely to have been retained. Trade will have continued for some businesses.
New Zealand will have more challenges in the post-lockdown phase
Most businesses in New Zealand will currently have no or very limited revenues, but will have continuing costs such as rents, wages and other bills. This will have consequences for ongoing viability and employees’ prospects. New Zealand’s firms are mostly small or medium sized enterprises (SMEs) without large balance sheets to absorb major shocks. Young people are not in education or are being supervised by parents at home, which creates its own pressures. There will be mental illness ramifications because of continued confinement, job losses and uncertainty about the future. Police are reporting higher instances of domestic violence due to people being at home with each other more than usual.[1]
When the lockdown policies are lifted, the businesses that are still in operation will face a double challenge. Consumer demand be suppressed, and many New Zealand businesses will have the additional challenge of restarting from zero activity.
EDIT: An earlier version of this blog did not make clear that some public transport in New Zealand continues to operate.
Update: On April 21, this blog post was referenced by The New York Times in their article about New Zealand’s economic recovery post COVID-19.
[1] https://www.nzherald.co.nz/nz/news/article.cfm?c_id=1&objectid=12324065
Image by Fernando Zhiminaicela
About the Authors: Andreas Heuser is a Manager in Castalia’s New Zealand office and Alex Sundakov is Castalia’s Executive Director in Australia.
Disclaimer: The views expressed are those of the authors alone. This work has not received funding from any other organisation or interest.
Many governments are concerned about how to stimulate economic activity once the COVID-19 health crisis is in a manageable state.
This blog examines New Zealand’s unique stimulus approach, which focuses on “shovel-ready” infrastructure. This approach promises to stimulate economic activity while minimizing risks of wasteful spending. The New Zealand approach could inform how governments and multilateral development banks (MDB) approach financial stimulus support in developing countries.
Infrastructure spending is a safe stimulus option to overcome the unprecedented demand shock.
The world will be able to get back to work once the pandemic spread slows, probably later this year. It will be essential to get people back to work quickly and stimulate economic activity. Furthermore, the infrastructure spending could make the post-crisis world more resilient.
Sound infrastructure underpins all economic activity and, in most countries, infrastructure constraints are usually well-understood by both the government and the private sector. Therefore, with appropriate controls in place, the chances that a government-supported infrastructure project will fail to stimulate economic activity, or be wasteful in the long term, are lower than for a non-infrastructure project.
New Zealand’s “shovel-ready” approach is interesting.
New Zealand has an interesting and potentially replicable idea for fiscal stimulus. The government has announced a plan to increase infrastructure spending quickly once the pandemic restrictions end. What is special about the New Zealand approach is that the government has announced the plan now, even though it may be months before it can be implemented.
The government has called for information about “shovel-ready” projects. These are infrastructure projects that can commence in the next six to 12 months. The deadline for submitting information is 14 April 2020.
By announcing and kicking off this plan now, in the midst of the pandemic restrictions, the government is providing a clear signal of its intentions, and some certainty to the infrastructure sector about which projects might be under consideration for fiscal support.
The New Zealand plan rapidly identifies potential infrastructure projects that can be commenced soon. This increases the likelihood that the positive economic impact of infrastructure project development occurs during the period that demand is suppressed and people are out of work. The plan also provides government support at a time when economic activity in the private sector is likely to be low, thus reducing potential “crowding out” of private spending.
New Zealand’s criteria and process for “shovel-ready” infrastructure projects.
New Zealand has appointed a reference group of infrastructure experts and senior officials to receive information about potential projects. The group will further develop criteria to evaluate projects for the Government to consider.
At this initial stage, in addition to the time-driven “shovel-ready” requirement, the following high-level criteria will apply:
- Demonstrated positive direct and indirect employment effects
- Demonstrated social, environmental and economic benefits, with emphasis on the New Zealand Treasury’s Living Standards Framework and the UN’s Sustainable Development Goals.
Project developers must also outline how COVID-19 has affected the project and how COVID-19 presents risks to on-time construction and completion to specifications. Project developers are also asked to outline specifically how Government could support their project. This can include:
- Financial support
- Expedited regulatory approvals (for example, environmental permits or planning permissions)
- Regulatory or law changes to enable infrastructure (for example, fast-tracking foreign investor rules)
- Other government support (for example, commitments by government to use the infrastructure or purchase services).
The full criteria and process for evaluating projects will be developed in the coming weeks. New Zealand has well-developed infrastructure evaluation frameworks for public capital investment (Better Business Case framework, overseen by the Treasury). We expect further information on a robust evaluation process to emerge soon.
Developing countries can develop a “stimulus tool kit” borrowing from New Zealand’s “shovel-ready” approach.
There are some lessons from the New Zealand approach that developing countries and MDBs could apply. Developing countries are likely to be fiscally stretched, and therefore infrastructure stimulus might be financed by MDBs and other donors.
Many countries will want MDB support. MDBs should consider developing a “post-COVID infrastructure stimulus toolkit”, which any interested country could adopt.
The toolkits should be rolled out as soon as possible. This will allow countries to identify projects and get them shovel ready now. An information-gathering exercise, such as the New Zealand “shovel-ready” approach, can be done quickly. The sooner MDBs begin to think about criteria for infrastructure finance, the faster infrastructure developers and investors can respond with projects that can deliver immediate economic and longer-term resilience benefits.
Key features, which can be rapidly developed, include:
- Ensuring a project evaluation body is appropriately qualified and suitably independent
- Identification of the key results sought from projects, such as jobs, environmental sustainability, social inclusiveness, and resilient infrastructure
- Mechanisms to determine project timeframes and risks to meeting timeframes.
Some precedents already exist for rapid disbursement methodologies. These could be applied for post-COVID infrastructure. P4R (Pay for Results) could be incorporated. A P4R loan, for example, could disburse X amount per km of road built to the required standard, which would be much quicker than normal MDB processes.
Even so, provisions to ensure that the projects funded are ones that are needed, would be important—here the New Zealand “shovel-ready” criteria could be considered as a base. Proper construction supervision would need to be ensured also.
Author: Andreas Heuser, Andreas.Heuser@castalia-advisors.com
Disclaimer: The views expressed are those of the author’s alone. This work has not received funding from any other organisation or interest.
As the costs of regulatory responses to COVID 19 mount, we have developed a framework analyzing which measures governments should adopt, when, and for how long.
How do we plan the next phase of the fight against COVID 19?
As New Zealand begins its second week of lockdown, with only essential services operating, some difficult questions are emerging. The economic pain is mounting, the social impact is enormous, we need to get out of this situation as quickly as we can. How do we know which restrictions to relax first and when? Can we remove the most stringent restrictions a week early? In this thought piece we seek to develop a rigorous method to chart a path out of lockdown.
In case you’ve been living in a bubble for the last two weeks…
The COVID 19 virus is spreading around the world at pace. Expectations for creating a vaccine range from 12-24+ months. Other drugs to treat the virus have potential but are not yet proven and no timeline exists for their production and dissemination. The reported death rates vary from 0.5 percent in places where intensive care is available to 5 percent in places where health systems are overwhelmed. No nation’s medical system has enough capacity to deal with uncontrolled spread due to the speed at which COVID 19 transmits.
Unprecedented actions are being taken as governments around the world make radical regulatory calls to shutdown large swathes of economic activity to limit the spread of the virus. In New Zealand this is called ‘lockdown’ and people are required to stay in their homes except for essential service needs. All non-essential businesses are closed.
The objective of lockdown is to reduce the COVID 19 transmission rate (R) to a manageable level
R is the transmission rate of the virus – it is the speed at which COVID 19 spreads. For each infected person, R is the number of people they will go on to infect. An R greater than 1 means that the virus will grow in the population, an R less than 1 implies the virus will die out.
In the absence of interventions, COVID 19 has an R of approximately 2.5[1]. This means that in the absence of interventions, every infected person would go on to infect 2.5 other people. This is substantially higher than the seasonal strains of influenza[2] that infect large proportions of the world’s population each year.
A manageable level of cases is defined by the capacity of the health system to cope with the case load until a vaccine is developed and distributed (12-24 months). Modelling of outcomes under different response strategies is shown in the chart below.
Figure 1: Epidemic Modelling of the spread of COVID 19 in New Zealand under Mitigation and Suppression Strategies
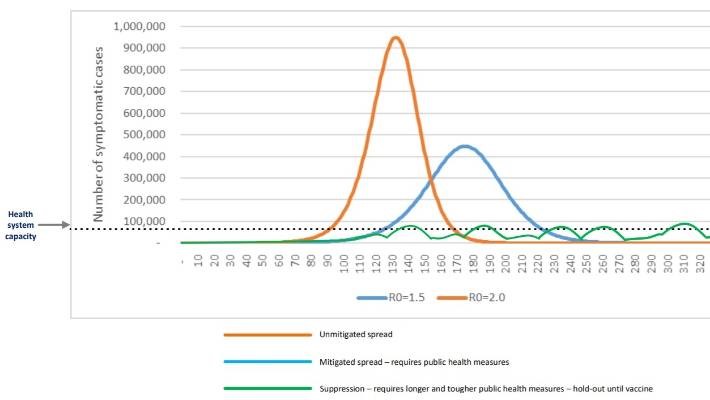
Source: University of Otago, cited in https://www.nzherald.co.nz/nz/news/article.cfm?c_id=1&object id=12321353
There is evidence emerging that the initial lockdown phase is working to reduce R below 1
In New Zealand, the daily number of new cases appears to have stopped increasing in the past week, as shown in the chart below. Further evidence is required to confirm the new rate of infection under lockdown. At the time of writing, the lockdown appears to be working and the health care system is not overwhelmed. This could change at any time however and in two weeks we will know with more certainty.
There is evidence of suppression measures working in Korea, China, and Taiwan. Analysis of infection rates in Hubei province, China, suggests that R fell to 0.32 during the height of local suppression efforts[3] (though there is some doubt on the reliability of Chinese data[4]). This had led to a substantial reduction in the actual number of people infected in Hubei. This level of effectiveness would be enough to halt the growth of the virus in the population with a significant margin of error.
We will not have to wait long for an empirical understanding of the R that the lockdown measures are achieving in New Zealand. Over the next few weeks, we will have enough observations to determine the trend in our infection rate under lockdown, and thus calculate R. For this piece of analysis, we use 0.32 as an illustrative estimate of what the total impact of our lockdown measures might be. The actual number may be higher or lower, and we will know this soon.
Figure 2: Confirmed and Probable New COVID 19 Cases in New Zealand, 1 April
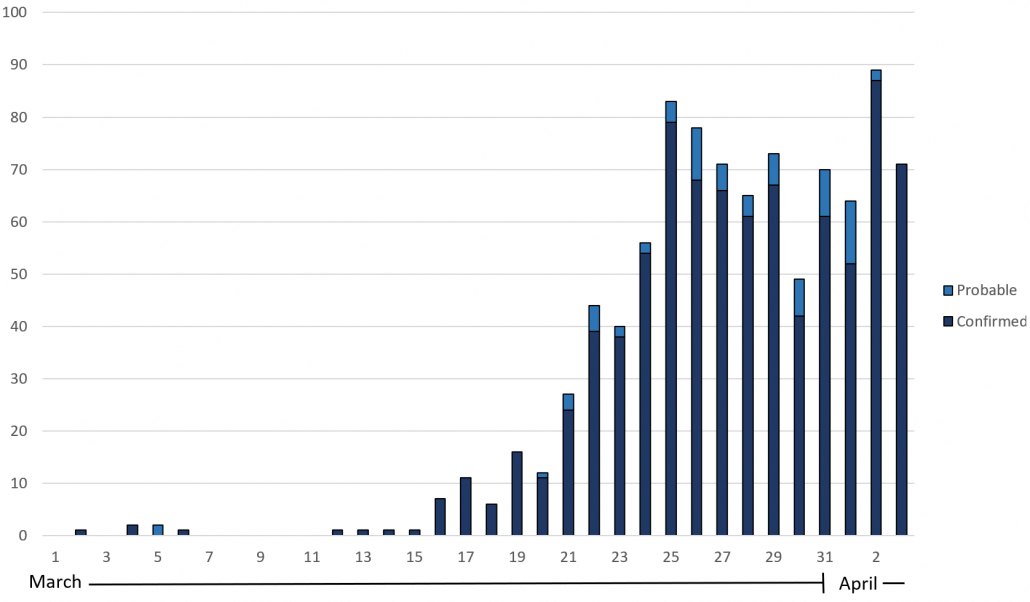
Source: https://www.health.govt.nz/our-work/diseases-and-conditions/covid-19-novel-coronavirus/covid-19-current-situation/covid-19-current-cases/covid-19-current-cases-details
Stringent public health measures carry enormous economic and social costs
To gain control of the outbreak in the initial phase almost all measures that reduce R should be taken, but the costs of these measures cannot be sustained for long. Lockdown measures carry enormous social costs, losses in productivity, administration costs, and compliance costs. Over time additional costs could emerge as new problems are created in areas such as law and order, domestic violence, mental health, lost educational opportunities, and the like.
There is now a rapidly compounding economic crisis. New Zealand’s GDP may fall by 10 percent in the three months to June, and at the point of lockdown economic activity fell by 40 percent immediately, according to some commercial bank estimates[5]. Not all of these costs can be attributed to the public health measures, however. Some of these costs will be incurred irrespective of the measures the New Zealand Government takes because restrictions imposed by other countries and the severe downturn in the global economy will impact New Zealand in any case.
Undershooting interventions early on carries an enormous economic cost in lives lost, however, overshooting (either maintaining restrictions for too long or imposing them unnecessarily) equally carries enormous economic costs. The magnitude of these impacts necessitates that we have a robust balancing method that is nimble and effective.
To guide decisions, we need a strategy for relaxing restrictions that balances the risk of further outbreaks against social and economic costs
Interventions range from detection and isolation of cases, to public hygiene campaigns, travel restrictions, assembly restrictions and forced closures of businesses and institutions.
We have compiled the following list of potential interventions to reduce the transmission of COVID 19 in New Zealand. This list is not exhaustive. Most, although not all, have been included in the lockdown phase in New Zealand.
Table 1: Potential Interventions to Reduce the Transmission of COVID 19
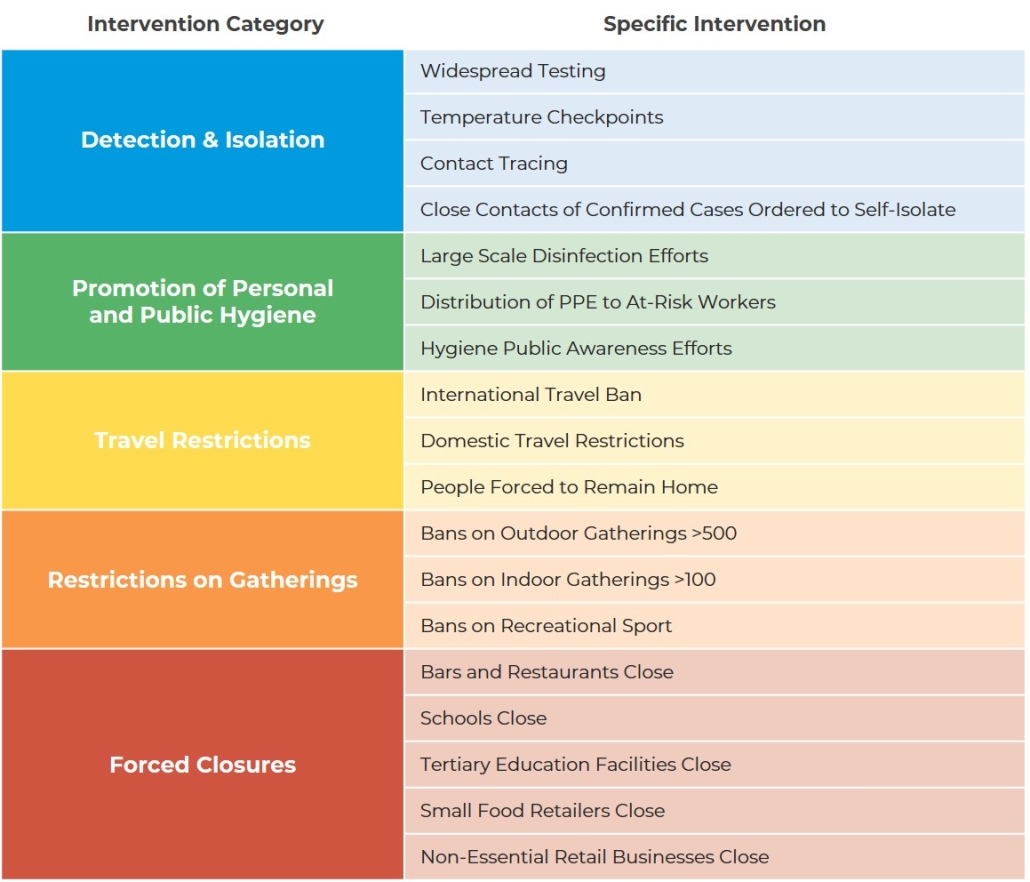
Source: Castalia
Which of these interventions will remain necessary in the next phase?
When we reverse the spread of COVID 19 and reach a manageable number of infected people, the key questions for policy makers will be which of these restrictions can be relaxed and when. The two factors to consider when making these decisions are:
- The impact the restriction has on the transmission rate (R)
- The economic cost of the restriction.
It will make sense to remove the least cost-effective interventions up to the point when R approaches 1. If R can be held at or below 1 then the number of infected people will stay constant or reduce over time. Reducing R substantially below 1 for too long will carry unnecessary cost.
The impact on R and the economic cost of each intervention are not known with certainty at this point but we can make reasonable estimates based on overseas evidence adjusted for New Zealand specific factors.
Evidence of lockdown policies effectiveness are emerging in South Korea, Singapore, Hong Kong and China. Effectiveness of the interventions listed above can be measured as reducing R from 2.5 to 0.32[6] (a change of 2.18). Reducing R to zero would mean a change of 2.5 (but no country has yet reported this). We recognise that there will be cultural differences in the effectiveness of individual measures, but this is an empirical example of the total potential impact of lockdown measures on R.
If we estimate the total potential impact of lockdown measures, then we are primarily concerned with the relative effectiveness of each intervention. Table 2 shows illustrative estimates of the impact of individual interventions on R, scaled so that the sum of all interventions is ΔR 2.18[7]. The interventions were first categorised as having either ‘Low’, ‘Medium’, or ‘High’ effectiveness. We assume that Interventions labelled ‘Medium’ are half as effective as those labelled ‘High’, while those labelled ‘Low’ are half as effective as those labelled ‘Medium’. The largest observed ΔR (2.18) was then split between these interventions in proportion with these defined ratios. The results of this analysis are shown below.
Table 2: Illustrative Estimates of the Impact of Interventions on Transmission Rates
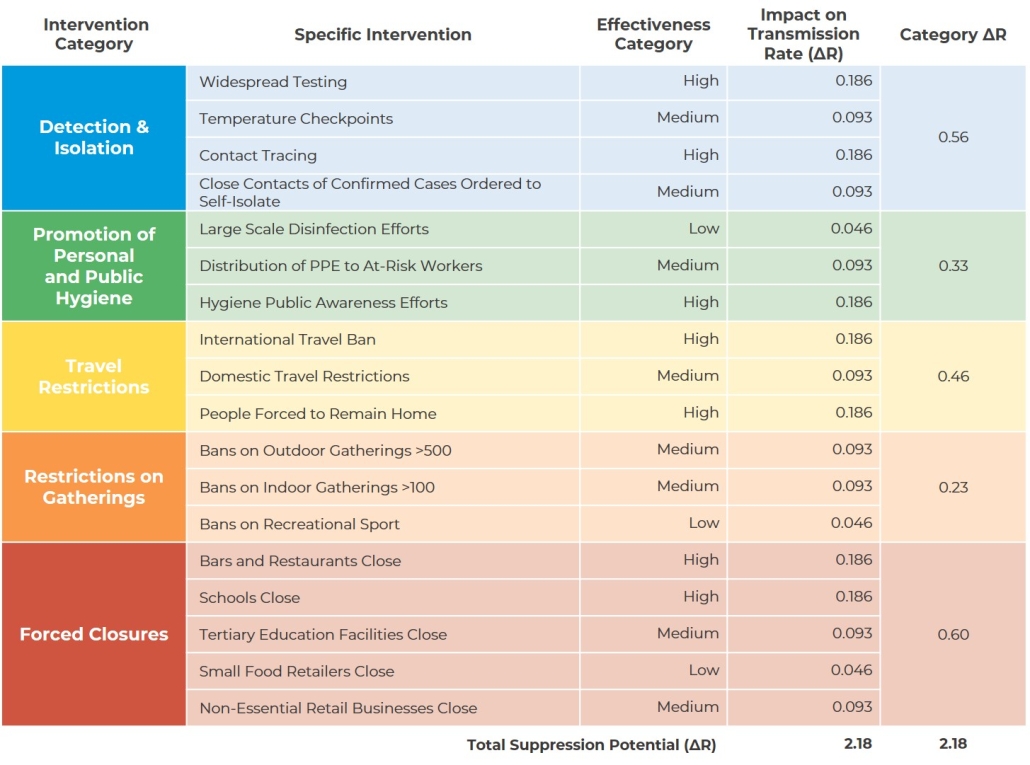
Source: Castalia
Notes: The actual ΔR for each intervention will depend on social, cultural, and geographic factors, meaning that each country is likely to have different results. We would also expect to see learning in each category, meaning that the effectiveness of each intervention should grow over time. We put these estimates forward to start a discussion about their real values in New Zealand. We welcome any empirical evidence or expert judgement that could improve these estimates.
What do these interventions cost us?
Economic costs include all impacts on society including administrative costs, compliance costs, and losses in productivity. It is the broadest measure that seeks to account for all costs – not just observable traded costs. It is not to be confused with financial costs to an individual party as it includes all costs to society, traded and non-traded, irrespective of where they fall.
We are interested in the additional economic cost impact of each intervention and we exclude the costs that will occur anyway (for example costs resulting from reduced foreign demand due to outbreaks in trading partner economies).
We estimated the cost of interventions using categories from 1 (lowest) to 10 (highest). Table 3 shows initial estimates of the cost category each intervention might fall in to. These estimates are based on an initial assessment and carry significant uncertainty.
Table 3: Initial Estimates of the Real Economic Costs and Cost Effectiveness of Interventions
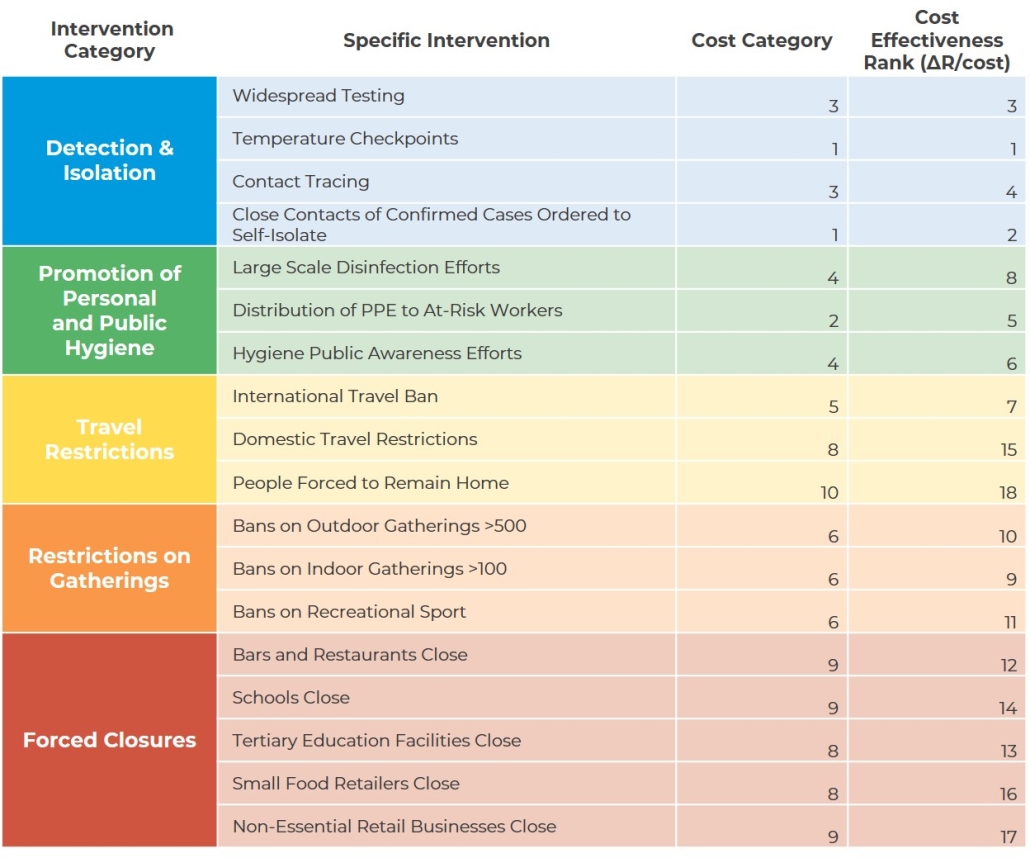
Source: Castalia
Notes: These are initial first estimates of categories of real economic costs, some of which are better understood than others. As with our estimates for ΔR, we put this categorisation forward to start a discussion about the real costs in New Zealand. We welcome any empirical evidence or expert judgement that could more precisely estimate the costs.
The next phase of virus control will involve progressive relaxation of interventions
Ranking interventions by cost-effectiveness, we can identify the interventions that should be relaxed first. The categories of interventions are listed in Figure 3 from those with the highest cost-effectiveness on the left, to those with the lowest cost-effectiveness on the right.
Figure 3: Prioritised Interventions by Category
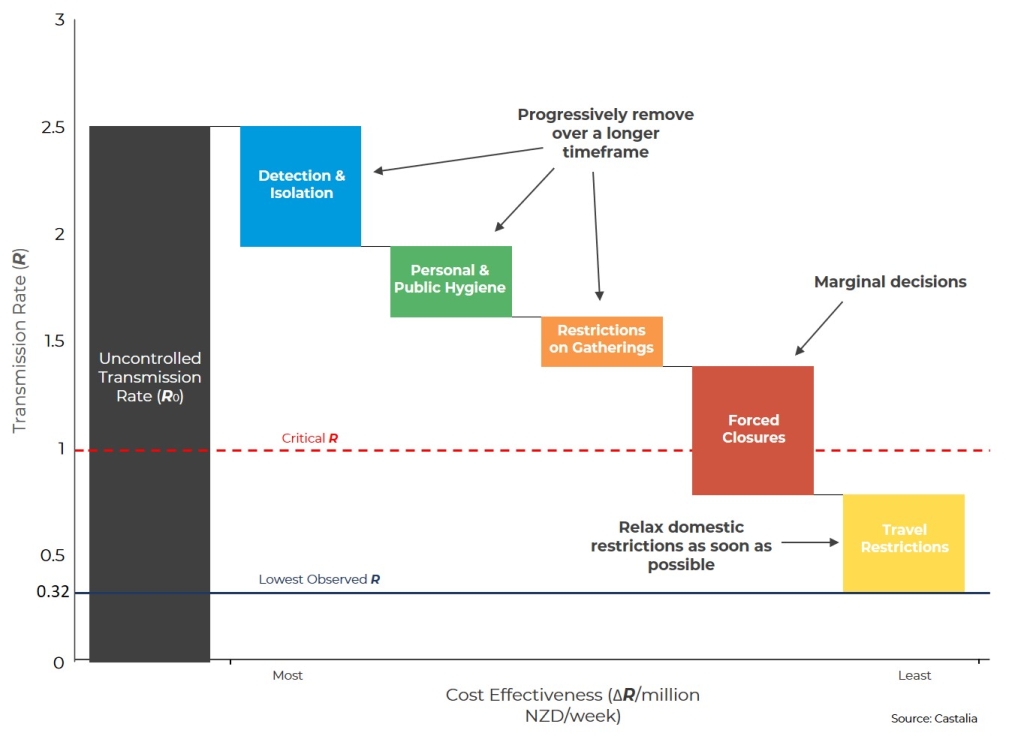
Using this framework, and our initial illustrative numbers, domestic travel restrictions would be eased first, since in this example such a relaxation would not result in exceeding the critical R = 1. Of course, this is illustrative only. The actual cost effectiveness ranking of the various interventions can only be estimated once more data has been gathered and more analysis done.
In conclusion
Our proposed framework, properly applied, can provide a foundation for the difficult policy decisions of if, when and which interventions to relax. To properly apply the framework, we need to gather and assess information on the economic costs of the various interventions. Additional, more in-depth analysis is required before applying the framework to ease any restrictions. If we can get the evidence, then we can use this framework to find the most cost-effective way to protect New Zealanders against the corona virus epidemic.
[1] This is known as the ‘basic reproduction number’ R0. Estimates for the R0 of COVID 19 range between 2 and 3 (James et al., 2020).
[2] Seasonal strains of influenza have an R0 of between 0.9 and 2.1. (see Coburn BJ; Wagner BG; Blower S (2009). “Modelling influenza epidemics and pandemics: insights into the future of swine flu (H1N1)”. BMC Medicine. 7. Article 30.)
[3] https://medium.com/@tomaspueyo/coronavirus-the-hammer-and-the-dance-be9337092b56
[4] The data from China are controversial, and there is evidence that some numbers are unreliable, so it is worth treating the Hubei estimate cautiously. There is, however, reported evidence that the number of new infections in Hubei have fallen since their local peak in January. This means that, by definition, Hubei has been able to achieve an R below 1.
[5] https://www.stuff.co.nz/business/120613593/westpac-forecasts-unemployment-will-climb-by-200000
[6] The lowest reported R.
[7] There are likely to be crowding-out effects between interventions whereby each additional intervention reduces the ΔR of all the other interventions applied. Conversely, as policy makers remove interventions, the ΔR of the remaining interventions will increase marginally. It is therefore reasonable to assume that the ΔR values for each intervention listed in Table 2 is a low estimate, and its effectiveness would increase if other interventions were removed. We have estimated a linear adjustment factor to account for this effect, which we intend to expand upon in subsequent posts.
Image by Fernando Zhiminaicela
About the Authors: Dylan James is a Director in Castalia’s Wellington Office and David Gawith is a Senior Analyst in Castalia’s Auckland office.
Dylan.James@castalia-advisors.com
David.Gawith@castalia-advisors.com
Disclaimer: The views expressed are those of the authors alone. This work has not received funding from any other organisation or interest.
Update: On April 6, this blog post was referenced by NZ Herald in their article about New Zealand’s path out of lockdown.
Update: On April 9, this blog post was referenced by Newsroom in their article about when and how governments should start loosening anti-virus controls.