Castalia’s blog

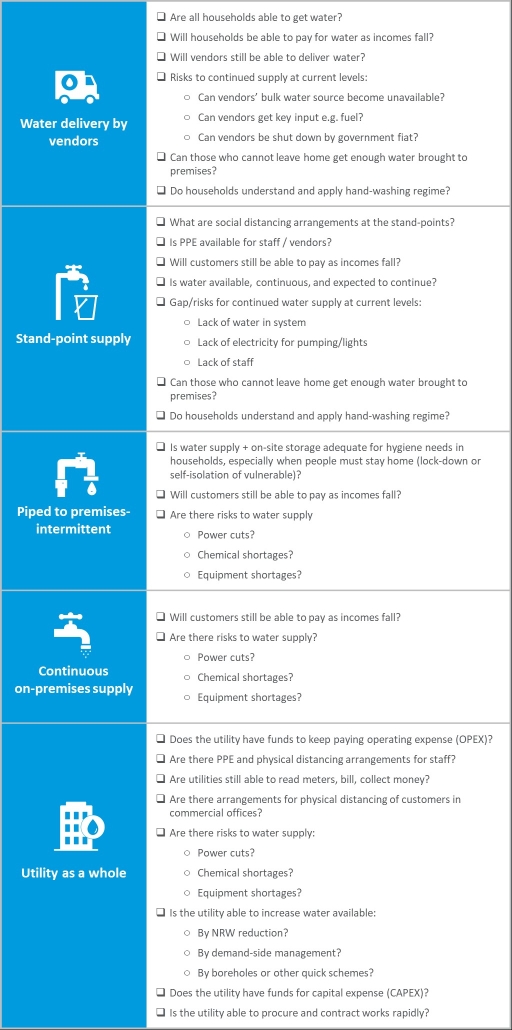
Water providers are on the front line fighting COVID19. Everyone needs water for hand-washing. People who are locked down or self-isolating need water at home. Yet in many places, water supply arrangements create risk. Groups gathered around a standpipe or water kiosk can quickly spread infection. So can water vendors going door to door. Water utility staff need protection from infection, in customer service offices, and when working with colleagues on operations and maintenance. Even worse, as economies grind to a halt, customers stop paying their bills. Without cash coming in, how can utilities pay salaries, and for the electricity that keeps the water pumping, and for the chemicals that make it safe?
To help utilities see clearly in this maelstrom of risk, we’ve created a Risk Identification Checklist. It delineates between risk categories: risks for communities that rely on water vendors, risks for those who use standpipes, risks for other customer groups, and finally risks that threaten a water utility’s overall ability to function. With this simple checklist, a utility or government can quickly identify where its big risks are—which is the first step in planning to respond to them. Please use this checklist. Let us know if it’s helpful. Please suggest improvements. Finally, if you need help in planning your response to the risks, let us know too – we may be able to help.
Author: David Ehrhardt
 https://pixabay.com/photos/laptop-business-man-from-above-2838918/
Governments around the world are shutting down businesses to slow the COVID-19 pandemic, while simultaneously trying to maintain employment and prevent widespread business bankruptcies. This post contrasts government responses in the five countries in which Castalia has offices: the USA, Australia, New Zealand, France and Colombia. Government responses fall into two main categories: business continuity programs (business loans) and employee protection programs (wage subsidies).
Table 1 summarizes what each country it doing to keep small and medium enterprises afloat during the crises. All five governments have instituted loan guarantee programs. These programs differ markedly in eligibility requirements, amount of the loan, extent of government guarantee provided, and whether the loans can be forgiven.
Table 1: Business Continuity Programs

The United States is the only country offering a 100 percent government guarantee on the loans. Governments in France and New Zealand will guarantee 90 percent and 80 percent of the loan, respectively, while Australia only offers a 50 percent government guarantee.
The higher the government guarantee on offer, the more likely banks are to lend to businesses that would otherwise go under – but the higher the fiscal costs when businesses which borrowed go bust. The US approach mandates that banks forego normal lending criteria. This is made commercially possible by the 100 percent guarantee protecting banks if businesses do go under. In contrast, while the New Zealand government has guaranteed 80 percent of the loan value, the Reserve Bank of New Zealand has instructed banks to continue to apply normal commercial lending criteria. This means that companies at risk of failing are not eligible for the loans. (It is not clear if this is deliberate or a misalignment between the government and the central bank.)
Turning to funds committed, France leads the pack, with government guaranteed loans totaling nearly 12 percent GDP (€300 billion).[1] In contrast, financing for business continuity programs in the US, New Zealand and Australia all equate to roughly 2 percent of GDP. New Zealand’s commitment of 1.84 percent of GDP (NZ$6.25 billion) to the Business Finance Guarantee Scheme is in line with Australia’s 1.78 percent of GDP (AU$40 billion) contribution to the SME Guarantee Scheme, and slightly more than the United States’ original commitment of 1.70 percent of GDP (US$349 billion) to the Small Business Paycheck Protection Program (‘PPP Loan’). Many countries have already pledged additional funding, so these figures are fluid.
Government programs aimed at keeping workers in employment are summarized in Table 2. In Australia and New Zealand, firms experiencing a 30 percent (or greater) drop in revenue due to COVID19 can receive a subsidy of AU$750 or NZ$585 per employee per week, respectively. Rebates of payroll taxes, and employer-deducted income tax, are also on offer.
In contrast, the US has created a wage subsidy scheme by offering up to 100 percent forgiveness of loans taken out under the business continuity (PPP) scheme, provided that at least 75 percent of the loan proceeds are spent on payroll costs. Businesses that get the loan may have up to two months of payroll costs covered by the government. The US approach has been to minimize paperwork, meaning there is no requirement for businesses to show they have experienced a reduction in revenue because of COVID19 to get the PPP loans and subsequent loan forgiveness.
Table 2: Employment Protection Programs
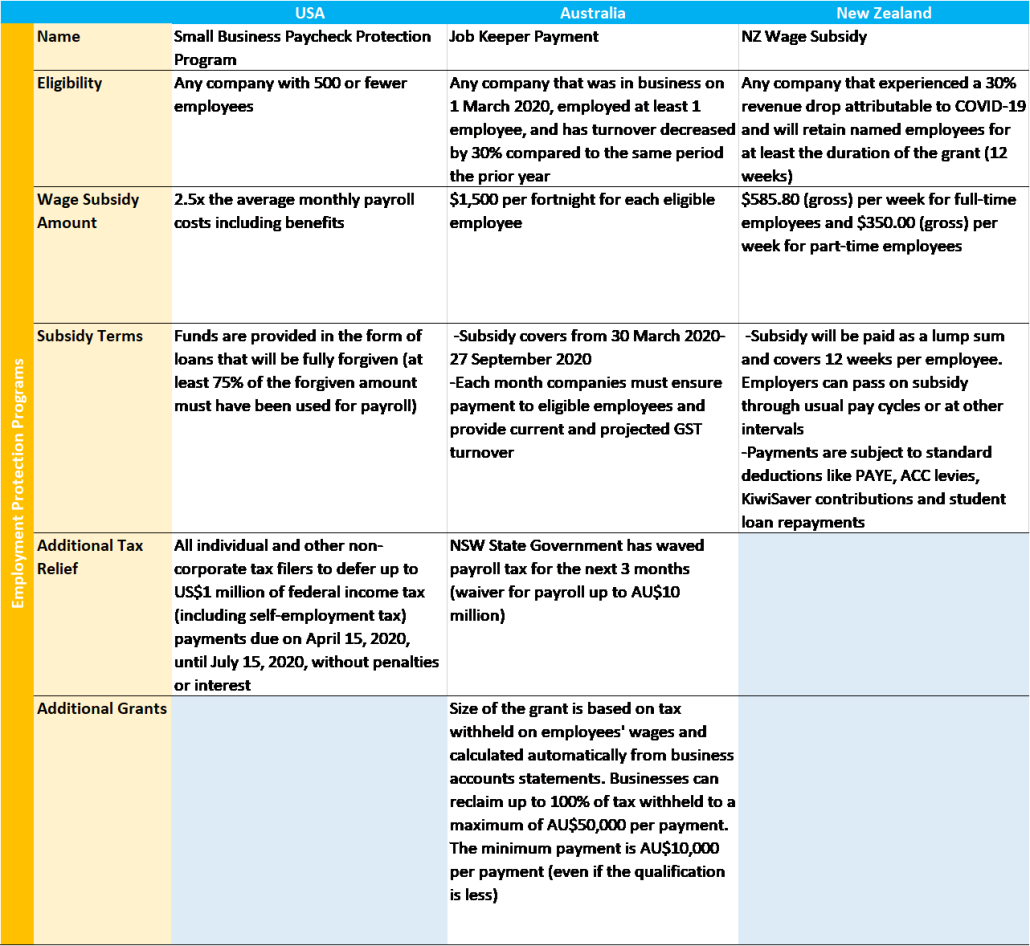
Commitments to the wage subsidy program vary significantly. Australia has pledged the most—nearly 6 percent of GDP to finance wage subsidies. New Zealand has committed approximately 3 percent of GDP, and the United States has promised just 1.70 percent of GDP to the PPP loan forgiveness (wage subsidy) program. Although there are many factors at work, it is interesting to note the growth of unemployment without direct wage subsidies. The rate of unemployment in the US is projected to soon reach 17 percent [2], significantly higher than Australia and New Zealand, which are both estimated to reach 10 percent[3][4] this quarter.
Authors: Morgan Kellman and David Ehrhardt
Photo by Lukas Bieri
[1] Calculations generated using 2018 GDP data from https://data.worldbank.org/country/. Accessed 27 April 2020.
[2] https://www.cnbc.com/2020/04/26/coronavirus-hassett-says-unemployment-will-approach-great-depression.html
[3] https://www.channelnewsasia.com/news/world/australian-unemployment-rate-to-double-as-covid-19-hammers-12639022
[4] https://www.newshub.co.nz/home/new-zealand/2020/04/coronavirus-new-zealand-could-face-10pc-unemployment-following-covid-19-lockdown.html
Sources for Table 1: https://home.treasury.gov/policy-issues/cares/assistance-for-small-businesses, https://treasury.gov.au/coronavirus/sme-guarantee-scheme, https://www.smartcompany.com.au/coronavirus/covid-19-stimulus-state-guide/, https://www.bnz.co.nz/contact/covid-19-update/business-finance-scheme, https://www.bloomberg.com/news/articles/2020-03-16/france-to-put-all-reforms-on-hold-to-focus-on-virus-macron-says, https://www.fng.gov.co/ES/Paginas/Unidos_por_Colombia_FNG.aspx
Sources for Table 2: https://home.treasury.gov/policy-issues/cares/assistance-for-small-businesses, https://www.ato.gov.au/General/JobKeeper-Payment/, https://www.employment.govt.nz/leave-and-holidays/other-types-of-leave/coronavirus-workplace/wage-subsidy/#eligibility

Infrastructure projects, and public-private partnerships in particular, around the globe and in all sectors have felt the impact of the COVID-19 pandemic, as supply chains and customer demand have been disrupted and health recommendations have changed the way business is conducted.
Many countries have taken action to limit the virus spread through social distancing policies, limiting work to only essential activities, closing schools and restricting travel. Approximately 90 percent of the world’s population has faced travel restrictions amid the COVID-19 pandemic.
User-fee concessions (including roads, carparks, airports, ports, ferries, etc.) are under great stress due to reduced demand. According to the International Bridge, Tunnel & Turnpike Association (IBTTA), traffic on tolled facilities in the United States is down by 50 to 90 percent. Availability fee-based projects may come under increased pressure as public sector counterparties face declining revenues and competing demands during the pandemic. While for many projects the problem is one of near-term liquidity, the long-term outlook for these assets could be in doubt if GDP growth forecasts are revised downward. The pandemic has brought into focus the risk to the financial performance of the PPP infrastructure projects and their ability to stay under construction, to operate and provide maintenance according to expectations, and to service debt.
Governments and authorities managing infrastructure concessions should get ahead of this through a rapid assessment of their PPP portfolios to identify and measure risk factors, including exposure under their force majeure (FM) clauses, develop action-oriented steps to manage the risks and, when appropriate, commence early engagement with private sector operators.
Force Majeure in PPP Agreements
Most international PPP agreements explicitly include FM clauses. FM clauses define the circumstances beyond a contracting party’s control in which a party’s nonperformance may be excused. At a minimum, such clauses typically allow an extension of time for performance and relief from liability for nonperformance by the party timely invoking it; in some cases they permit additional relief, such as an ability to terminate the contract and even in a minority of cases a pass-through of costs. As a creature of contract (rather than relief provided under statutory or common law), FM clauses can vary widely and the scope of events that qualify as FM and the relief available to a party impacted thereby will depend upon the specific language used in a contract. There is a lot of variability in PPP agreements, and the words chosen are important.
Certain claims of relief can be expected to be made under the most typical formulations of FM clauses in PPP agreements. For projects that have not yet achieved commercial operations, this may include deadline extensions, waiver of delay liquidated damages (LDs) and potentially pass-through of additional costs. For projects that are operational, this may include adjustments to performance standards, waiver of performance LDs, pass-through of additional costs and excuse from performance.
Impact on PPPs is Not Universal
While some projects deemed essential are progressing despite the pandemic, others are halted. In addition, some projects may be delayed due to supply chain disruptions of equipment and materials—such as structural steel from Asia. It is too early for hard figures, as the impact is not universal and is rapidly evolving—some projects continue and are able to overcome the crisis, some areas are harder hit than others. Disparate impacts are seen in both emerging markets PPPs and PPPs in established markets. There is only anecdotal information currently, such as:
- In mid-March, the mayor of Boston, Massachusetts halted all municipal construction projects for a minimum period of two weeks, which period has subsequently been extended.
- In Australia, construction projects continue and are exempt from the lockdown, with companies implementing staggered shifts and social distancing.
- In Bangladesh, the government suspended the construction works of all major infrastructure projects, reported to be worth more than US$30bn, including bridges, tunnels, power plants and rail.
- Despite early signals that supply chain impacts could lead to significant decline in US renewables, the US the Department of Energy is projecting annual wind and solar capacity additions at only 5 percent and 10 percent lower, respectively, due to the pandemic.
- Reports suggest that the construction plans for Nord Stream 2 remain unaffected by COVID-19 and the developer expects no impact from the social distancing measures on the implementation of the project.
There is a heightened concern about public sector entities’ ability to financially perform in a timely manner in some countries. The risk of increased delays in payments is due largely to further pressure on the governments’ finances, derived from a depressed economy. Governments and PPP agencies not only face concerns about the financial performance of the PPP projects, but also the operational performance in light of COVID-19.
Assessment by PPP Agencies and Governments in Emerging Markets
The availability of specific types of FM relief will depend upon the contractual language included in the PPP agreement. However, under some of the most common FM contractual language, the key questions PPP agencies should consider include the following: Is the private partner prevented from performance? Was the impact of COVID-19 something the private partner could have provided against? Are impacts covered under an insurance policy, or should they have been? Has the private partner taken reasonable steps to avoid or overcome the impacts of COVID-19? Are the remedies sought by the private partner contemplated by the PPP agreement? Does the private partner’s request for FM relief comply with the process requirements in the PPP agreement?
Action for Emerging Markets Governments to Take Now
- Stay up-to-date regarding the spread and impact of COVID-19 locally
- Stay abreast of the latest information related to the spread of COVID-19 locally, including the number of confirmed cases, number of deaths and capacity of hospitals, as the spread may impact claims for FM relief.
- Refresh the base of knowledge about their concession agreements, financial exposure under FM and financial models for each project to be ready to estimate possible FM exposure, and/or defend against unjustified FM claims.
- Learn how other PPPs and actors are addressing the impacts of COVID-19. Some actors may have crafted solutions to overcome the effects that could be applied to other PPPs.
- Assess the entire portfolio of PPP projects
- PPP agencies should assess the financial and operational performance of all PPP projects in their portfolio, identify the risks posed by COVID-19 to such projects and review the FM provisions contained within the applicable PPP agreements to determine the likelihood that a private partner may currently be entitled to or may soon be entitled to make a claim for FM relief.
- If it is determined that the private partner of a particular project is likely to claim FM relief, PPP agencies should consider what steps will be required of them in response. Will the PPP agency be obligated to respond or take action within a set period of time under the PPP agreement? Will a claim for FM relief under this project trigger obligations under other contracts? Are there public notice requirements for the PPP agency under law?
- Take proactive steps to prepare for claims
- Rather than wait for a partner to make a claim of FM and potentially end up in a dispute, engage with partners to determine the partner’s assessment of the risk of COVID-19 to its projects and its plans for addressing such risk.
- Consider on a project-by-project basis whether to negotiate and implement a COVID-19 response plan for the project in which the PPP agency and private partner agree to actions that each party should be taking now to address COVID-19, actions that each party will take in the future and the triggers for such actions.
- If necessary, consider on a project-by-project basis whether to negotiate amendments to the PPP agreement (for instance, to modify performance targets) in exchange for a waiver of FM relief related to COVID-19.
Other Related Issues
Emerging markets governments should also evaluate how their actions in response to COVID-19 may impact a private partner’s ability to perform under a PPP agreement. Restrictions on gatherings, nonessential businesses and travel may constitute a “Change in Law” under the PPP agreement, entitling the private partner to relief separate from and additional to the FM protections.
Further Information
For further information and discussions on force majeure in the context of COVID-19, please refer to the following: Force Majeure: Jurisdictional Comparison and Practical Legal and Commercial Considerations, Excusing Performance of Commercial Contracts due to ‘Force Majeure’, and Contract Cancellation and the Doctrines of Impossibility and Frustration of Purpose.
Authors
John J. Beardsworth, Jr. (co-author)
Benjamin Y. Cooper IV (co-author)
* Hunton Andrews Kurth LLP, an international law firm with over 1,000 lawyers practicing from 20 offices worldwide, has represented clients throughout Africa, Asia, Europe, Latin America and the United States on PPP transactions and other project matters for more than 30 years.
Read our other posts:


