Castalia’s blog
Castalia was hired by Open Country Dairy Limited to analyze a proposed capital restructure by Fonterra. The proposal would significantly change the number of shares in the dairy cooperative that prospective farmer-suppliers would have to acquire. The proposal is likely to collapse the price of Fonterra shares. It will shift significant wealth from current farmers to Fonterra itself. This has detrimental effects for competition in the milk processor market, compounding anti-competitive changes in 2020 to the Dairy Industry Restructuring Act 2001. The proposal is likely to lead to higher milk prices, including for domestic milk consumers.
The report is available here.
Queries about the report can be directed to andreas.heuser@castalia-advisors.com
Update 20 April 2022
Castalia has issued a response to comments from Fonterra and in the media about our report. The response is available here.

In this blog, two Castalia staff comment on the evidence base for the New Zealand “Three Waters” reforms. Andreas Heuser, who has lived mostly in New Zealand, and Lewis Whitelaw who has lived mostly in Scotland, describe how the government’s advice and analysis has included inappropriate comparisons between New Zealand and Scotland and why this is important in the context of New Zealand water sector reform. Although New Zealand and Scotland share unspoiled natural landscapes and picturesque lakes (or lochs for Scottish readers) their urban geography and urban water networks are quite different.
The New Zealand government is proposing a major reform of drinking, waste, and storm water services (Three Waters). The Government appointed the Water Industry Commission for Scotland (WICS) to provide analysis that has underpinned the reform proposals. WICS isthe economic regulator of Scottish Water, the publicly-owned monopoly water service provider in Scotland. WICS has drawn key conclusions for the New Zealand reform proposal from Scotland’s geography and water service experience. Conclusions like: “Scotland and New Zealand share many common geographical features – it seems likely, therefore, that the level of expenditure (before consideration of the potential for efficiency in asset management and capital expenditure delivery) required to achieve particular outcomes should be broadly similar …”. The government relies on WICS modelling for two claims:
- That significant capital investment is needed in the New Zealand water sector,
- The amalgamation of the water services of the 67 local authorities into four separate entities is the only way to achieve the cost-efficiencies to make the reform affordable.
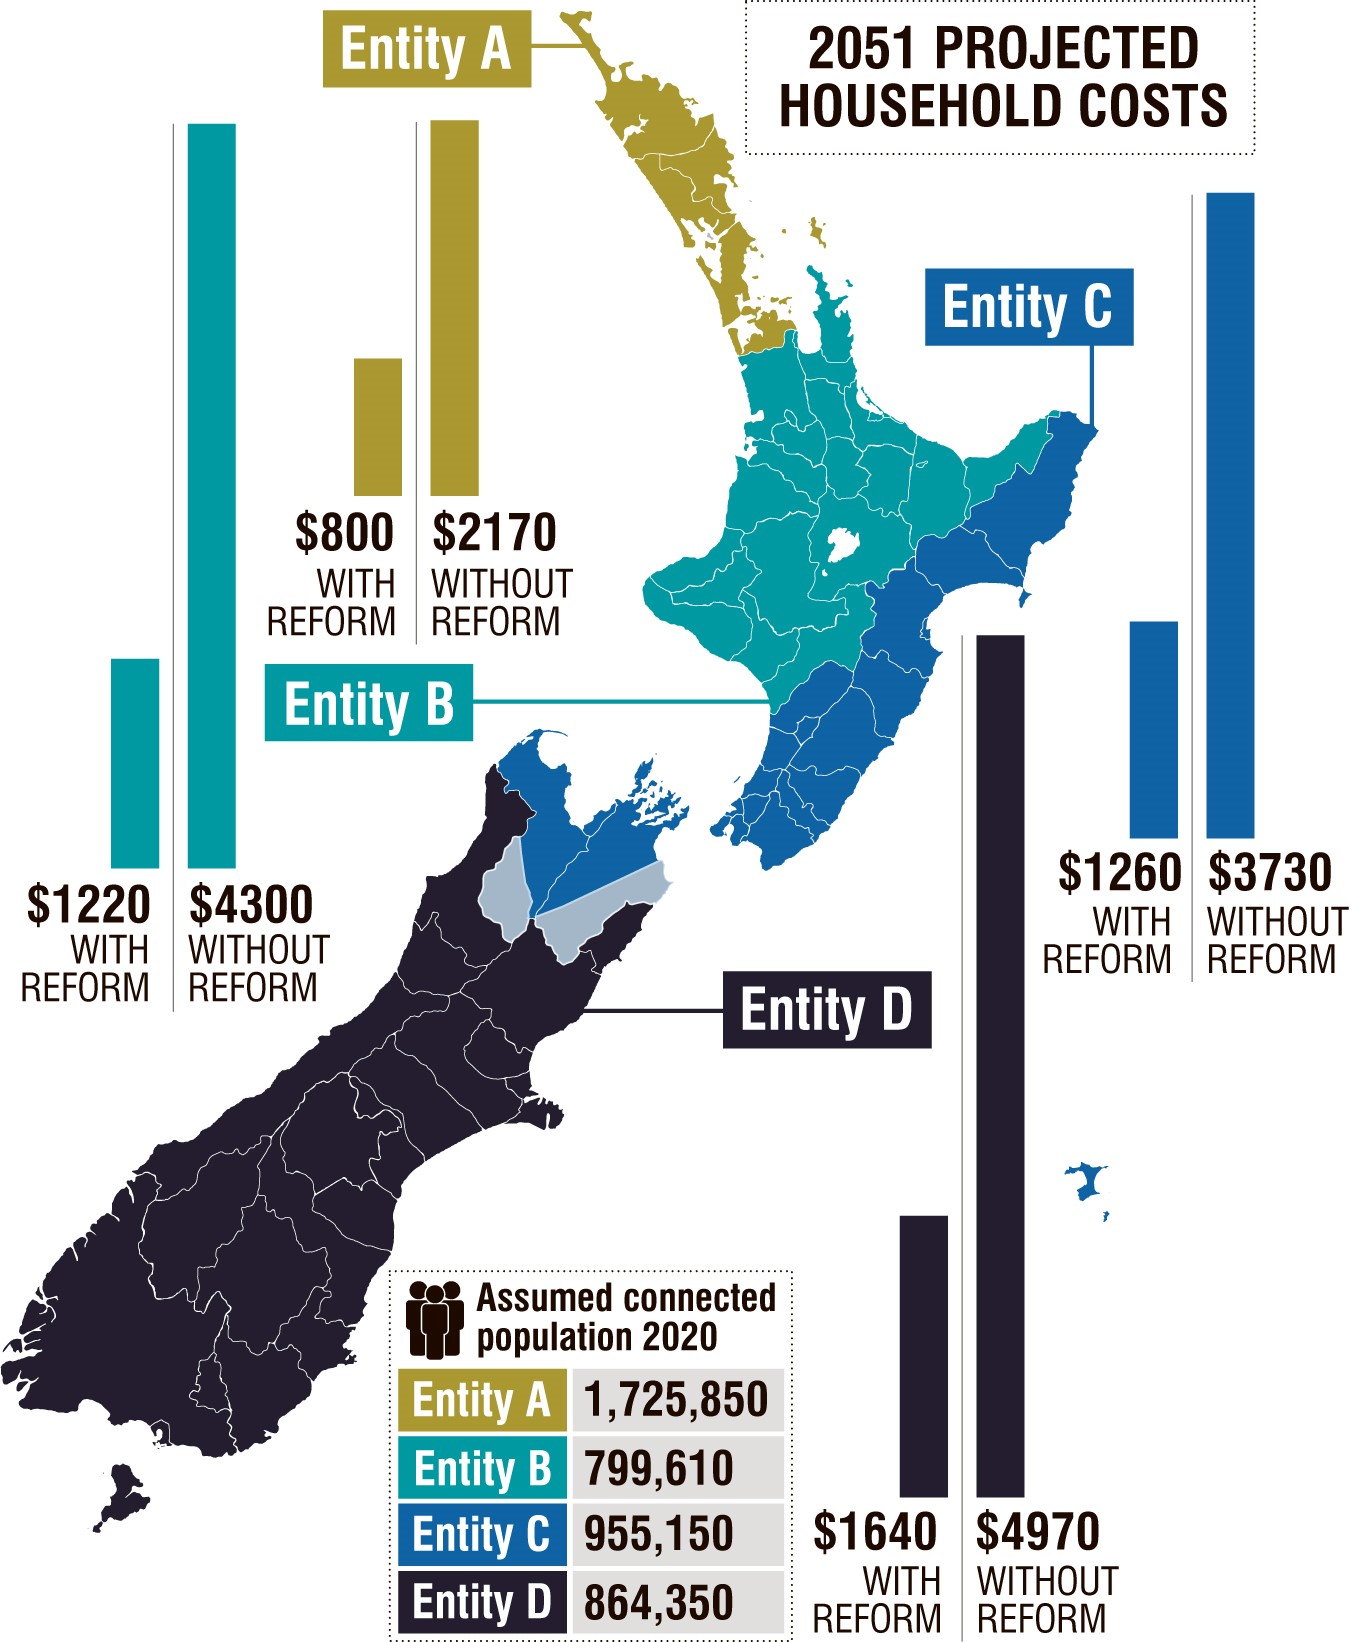
The image below shows the Government’s proposed four entities and predicted household bills based on WICS’ modelling.
Figure 1: Government’s proposed four entities and predicted household bills based on WICS’ modelling
Castalia has advised local authorities on the reform proposal
Castalia has advised several local authorities located in all of the four entity zones on whether the reform scenario will deliver the claimed benefits. We provided each with a robust understanding of the underlying assumptions that underpin the claimed benefits and uncovered key risks associated with the reform proposal. This included a detailed analysis of the geographic comparisons between Scotland and New Zealand made in the WICS modelling.
WICS justifies using Scotland as a model on the grounds that New Zealand has a low level of population density. WICS also assumes that the amalgamated New Zealand entities will achieve a 50 per cent capex efficiency improvement based on the single observation of claimed capex efficiencies in Scotland between 2002-2021. WICS suggest amalgamation will drive economies of scale efficiencies by “asset optimisation” (that is, the ability to consolidate water networks between towns).
Is New Zealand really like Scotland?
New Zealand and Scotland have comparable populations, 4.8 million and 5.3 million respectively. But the similarities start to end there.
New Zealand has a land area slightly larger than the whole of the United Kingdom, and therefore a much smaller population density. New Zealand is also highly urbanized. The population mostly lives in urban towns with significant distances between them. Of the total New Zealand population, 87 percent live in urban environments. New Zealand’s urban population increased by 8 percent between 1996 and 2018.
In Scotland, 83 percent of the population lives in urban environments. The urban population of Scotland is declining, according to the Scottish census agency.
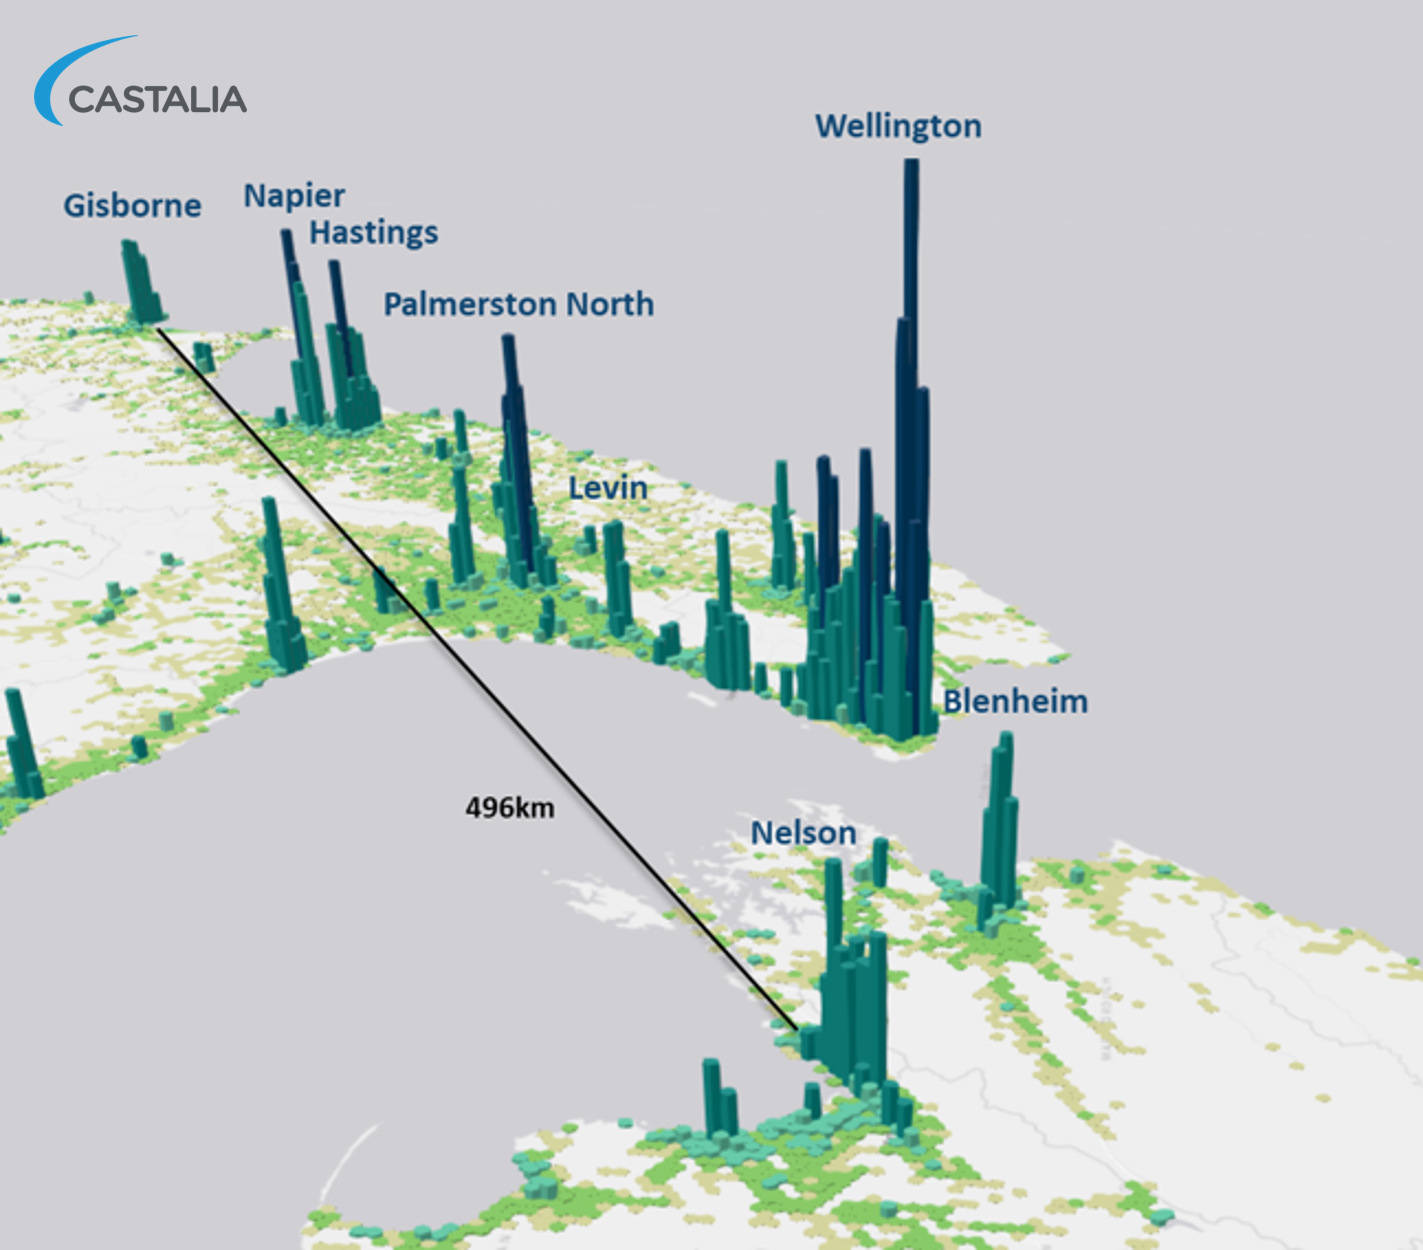
The image below shows the population densities and significant distances between towns in the proposed Entity C. The residents live across a wide geographic area, in a mixture of mostly urban settings. More than 500km by air separates Tairāwhiti and the East Cape from Takaka and Golden Bay (including the Cook Strait).
Figure 2: 3D population density map: Reform proposal Entity C
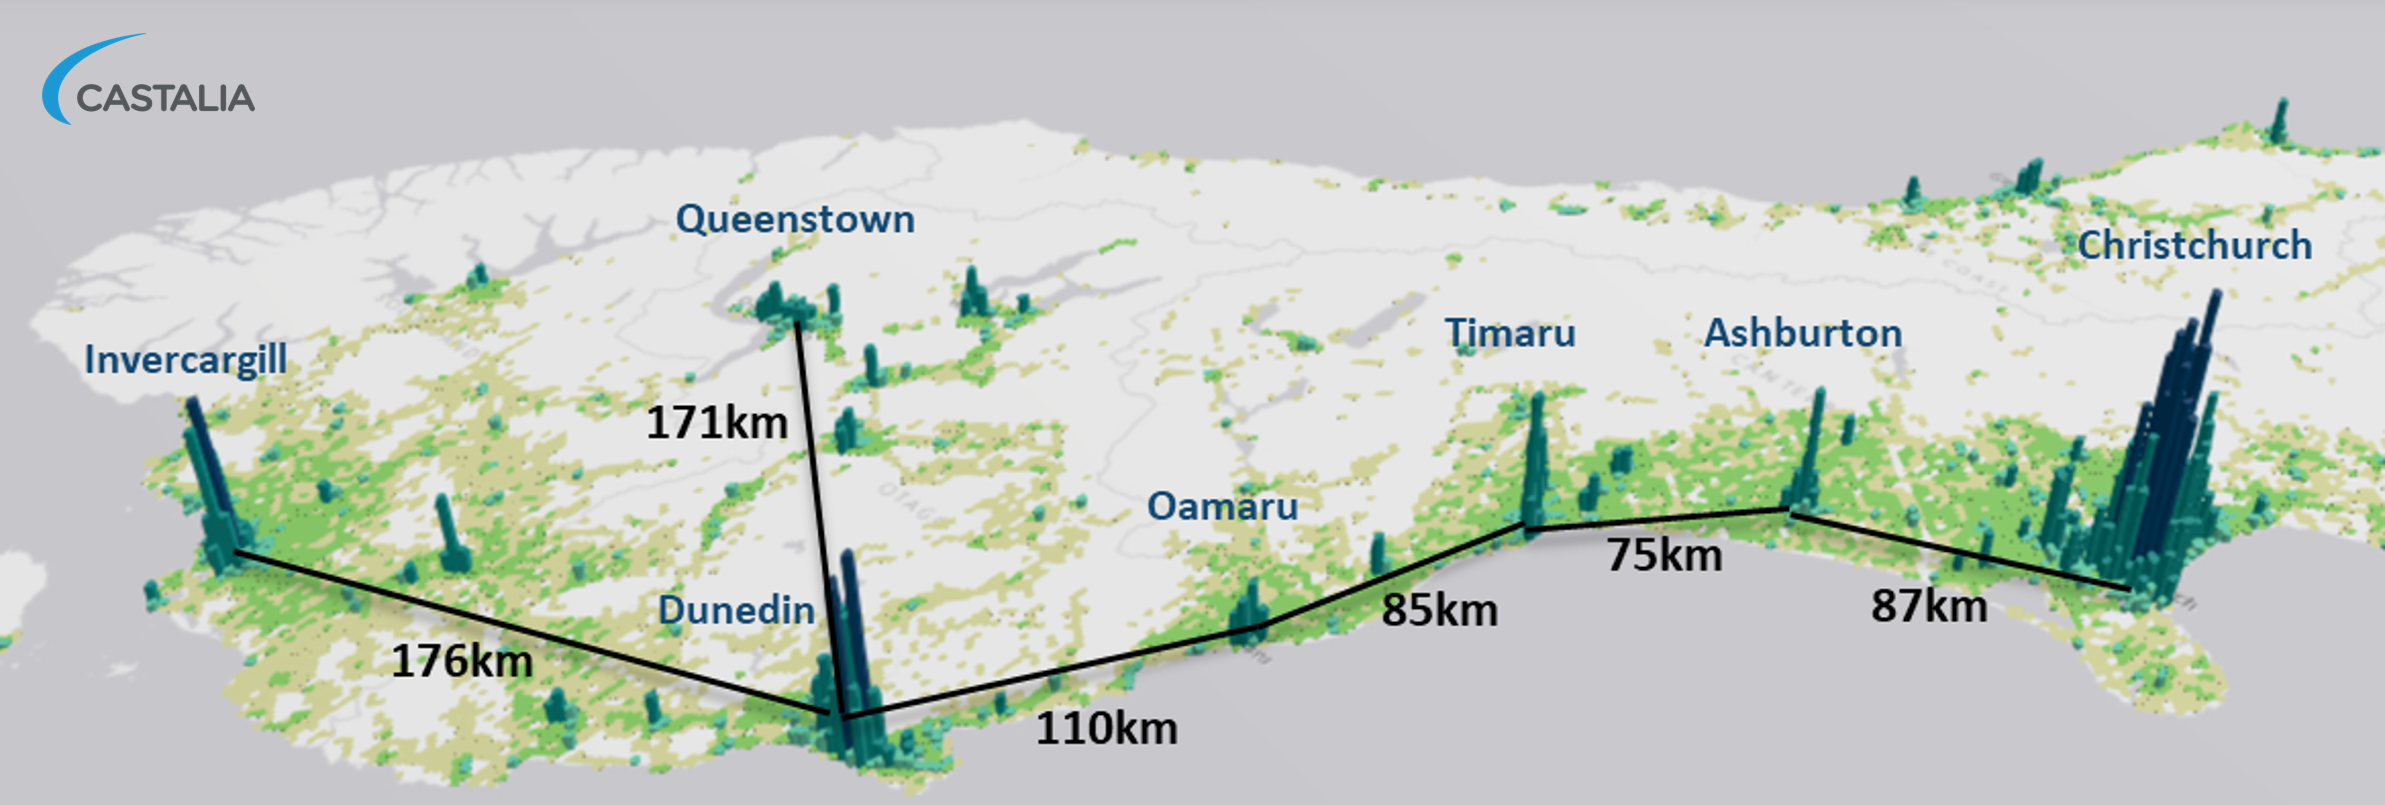
The towns and cities in Entity D are also separated by large distances, as the next image shows.
Figure 3: 3D population density map: Reform proposal Entity D
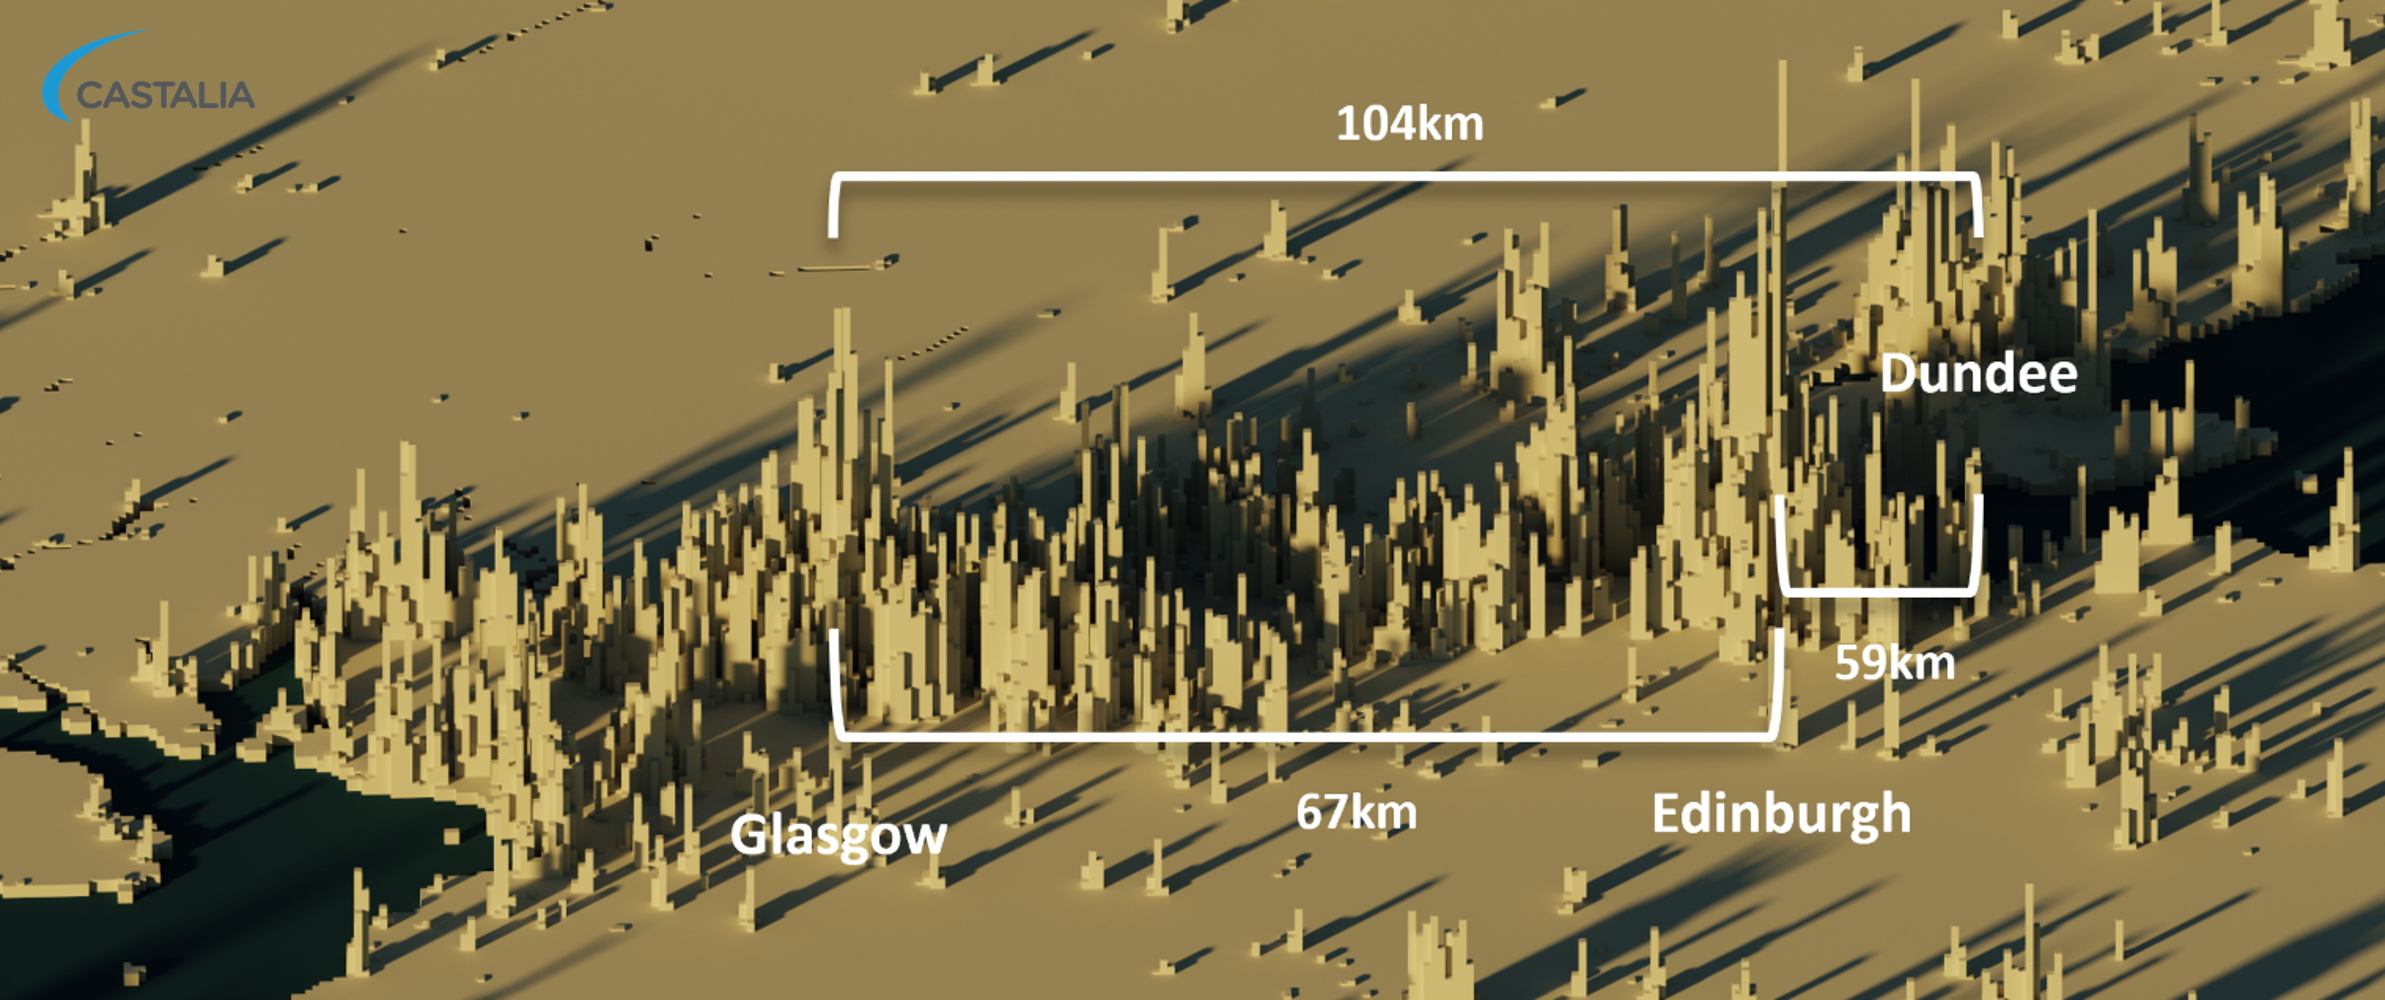
In comparison, most of the Scottish population live in towns and cities that are relatively close to one another. Around 80 percent of the Scottish population live in the central belt area that includes three of the four major Scottish cities Glasgow, Edinburgh, and Dundee as shown in the image below.
Figure 4: 3D population density map: Scotland central belt
The differences between Scotland and New Zealand lead to implausible findings in the water reform modelling
WICS claims similarities between parts of New Zealand and Scotland based on levels of urbanisation. However in the modelling, population density is used. As these images demonstrate, the population density is very different.
In water services, geography is important for the cost and quality of service. Denser urban areas tend to have lower average costs of service. Water services with more dispersed customers must distribute drinking water, and pump wastewater over longer distances with more pipes, dispersed treatment infrastructure, and higher costs.
If New Zealand is to achieve the cost savings that WICS says have occurred in Scotland, then these key differences in the geography must be acknowledged. The distances between New Zealand towns mean that any benefit of physical joining of networks will not be justified due to the cost of transporting water (pipes and pumps). Water is valuable, but unlike oil and electricity, its value-to-weight ratio is low. To get economies of scale in water networks, network mergers only make sense where communities are close enough so that the transport costs of moving water, chemicals, and water engineering and technical staff from one place to the other are low.
Unfortunately, WICS’ modelling assumes that cost savings are largely driven by the number of people served by a single entity, ignoring the question of how far the residents are from each other. This is inconsistent with the economic literature or the reality of running a water utility. The WICS efficiency claims cannot be reconciled with the urban geography of New Zealand. In some cases where water networks are close together and the administration is merged, efficiency gains are possible. However, such instances have already been mostly exploited in New Zealand, like in Wellington and Lower Hutt which have shared a water network for over 100 years, and have been under shared management since 2014 or Nelson City and Tasman District which share a wastewater treatment plant. The administrative amalgamations of disconnected and distant water networks in the New Zealand reform proposal are unlikely to produce the significant efficiency gains claimed in WICS’ modelling.
About the authors
Andreas Heuser is a Director at Castalia and New Zealander. He has led the Castalia analysis on New Zealand’s water sector reform. Andreas has stressed the importance of geographical considerations on the claimed benefits of the reform proposal.
Lewis Whitelaw is an Analyst at Castalia, Scotsman, and a New Zealand resident. He has contributed to Castalia’s water sector advice since his arrival from Scotland. Having lived in both Scotland and New Zealand, he was surprised to see the geographical comparisons made by WICS.

This work is licensed under a Creative Commons Attribution-NonCommercial-ShareAlike 4.0 International License.

Given significant decreases in costs and the ability to provide flexible power, Concentrated Solar Power (CSP) is expected to play a key role as a local and renewable source of power to cope with increasing amounts of variable renewable energy (vRE) in power systems.
Increasing amounts of vRE are posing challenges to power systems. First, solar photovoltaic (PV) without storage cannot meet demand at night, so other forms of supply are needed for nighttime power. Second, power systems must have the ability to ramp up and down during the day to complement the ramp-up of solar PV in the morning and ramp-down of solar PV in the evening, which coincides with the evening demand peak. Third, power systems must have the ability to cope with frequent variations in outputs from solar PV and wind power plants.
CSP with thermal energy storage is well-placed to address the first two challenges and complement solar PV in the power system of the future, instead of combined-cycle gas turbines (CCGT) (or other more expensive thermal power plants) that currently play this role. CSP with thermal energy storage can provide renewable power at night and has the capability to ramp up and down during the day in the same order of magnitude as CCT.
Click to download the Flexibility of CSP-White Paper.
This work is licensed under a Creative Commons Attribution-NonCommercial-ShareAlike 4.0 International License.
Read our other posts:


